


AMBCrypto - 7/22/2024 6:01:15 PM - GMT (+0 )

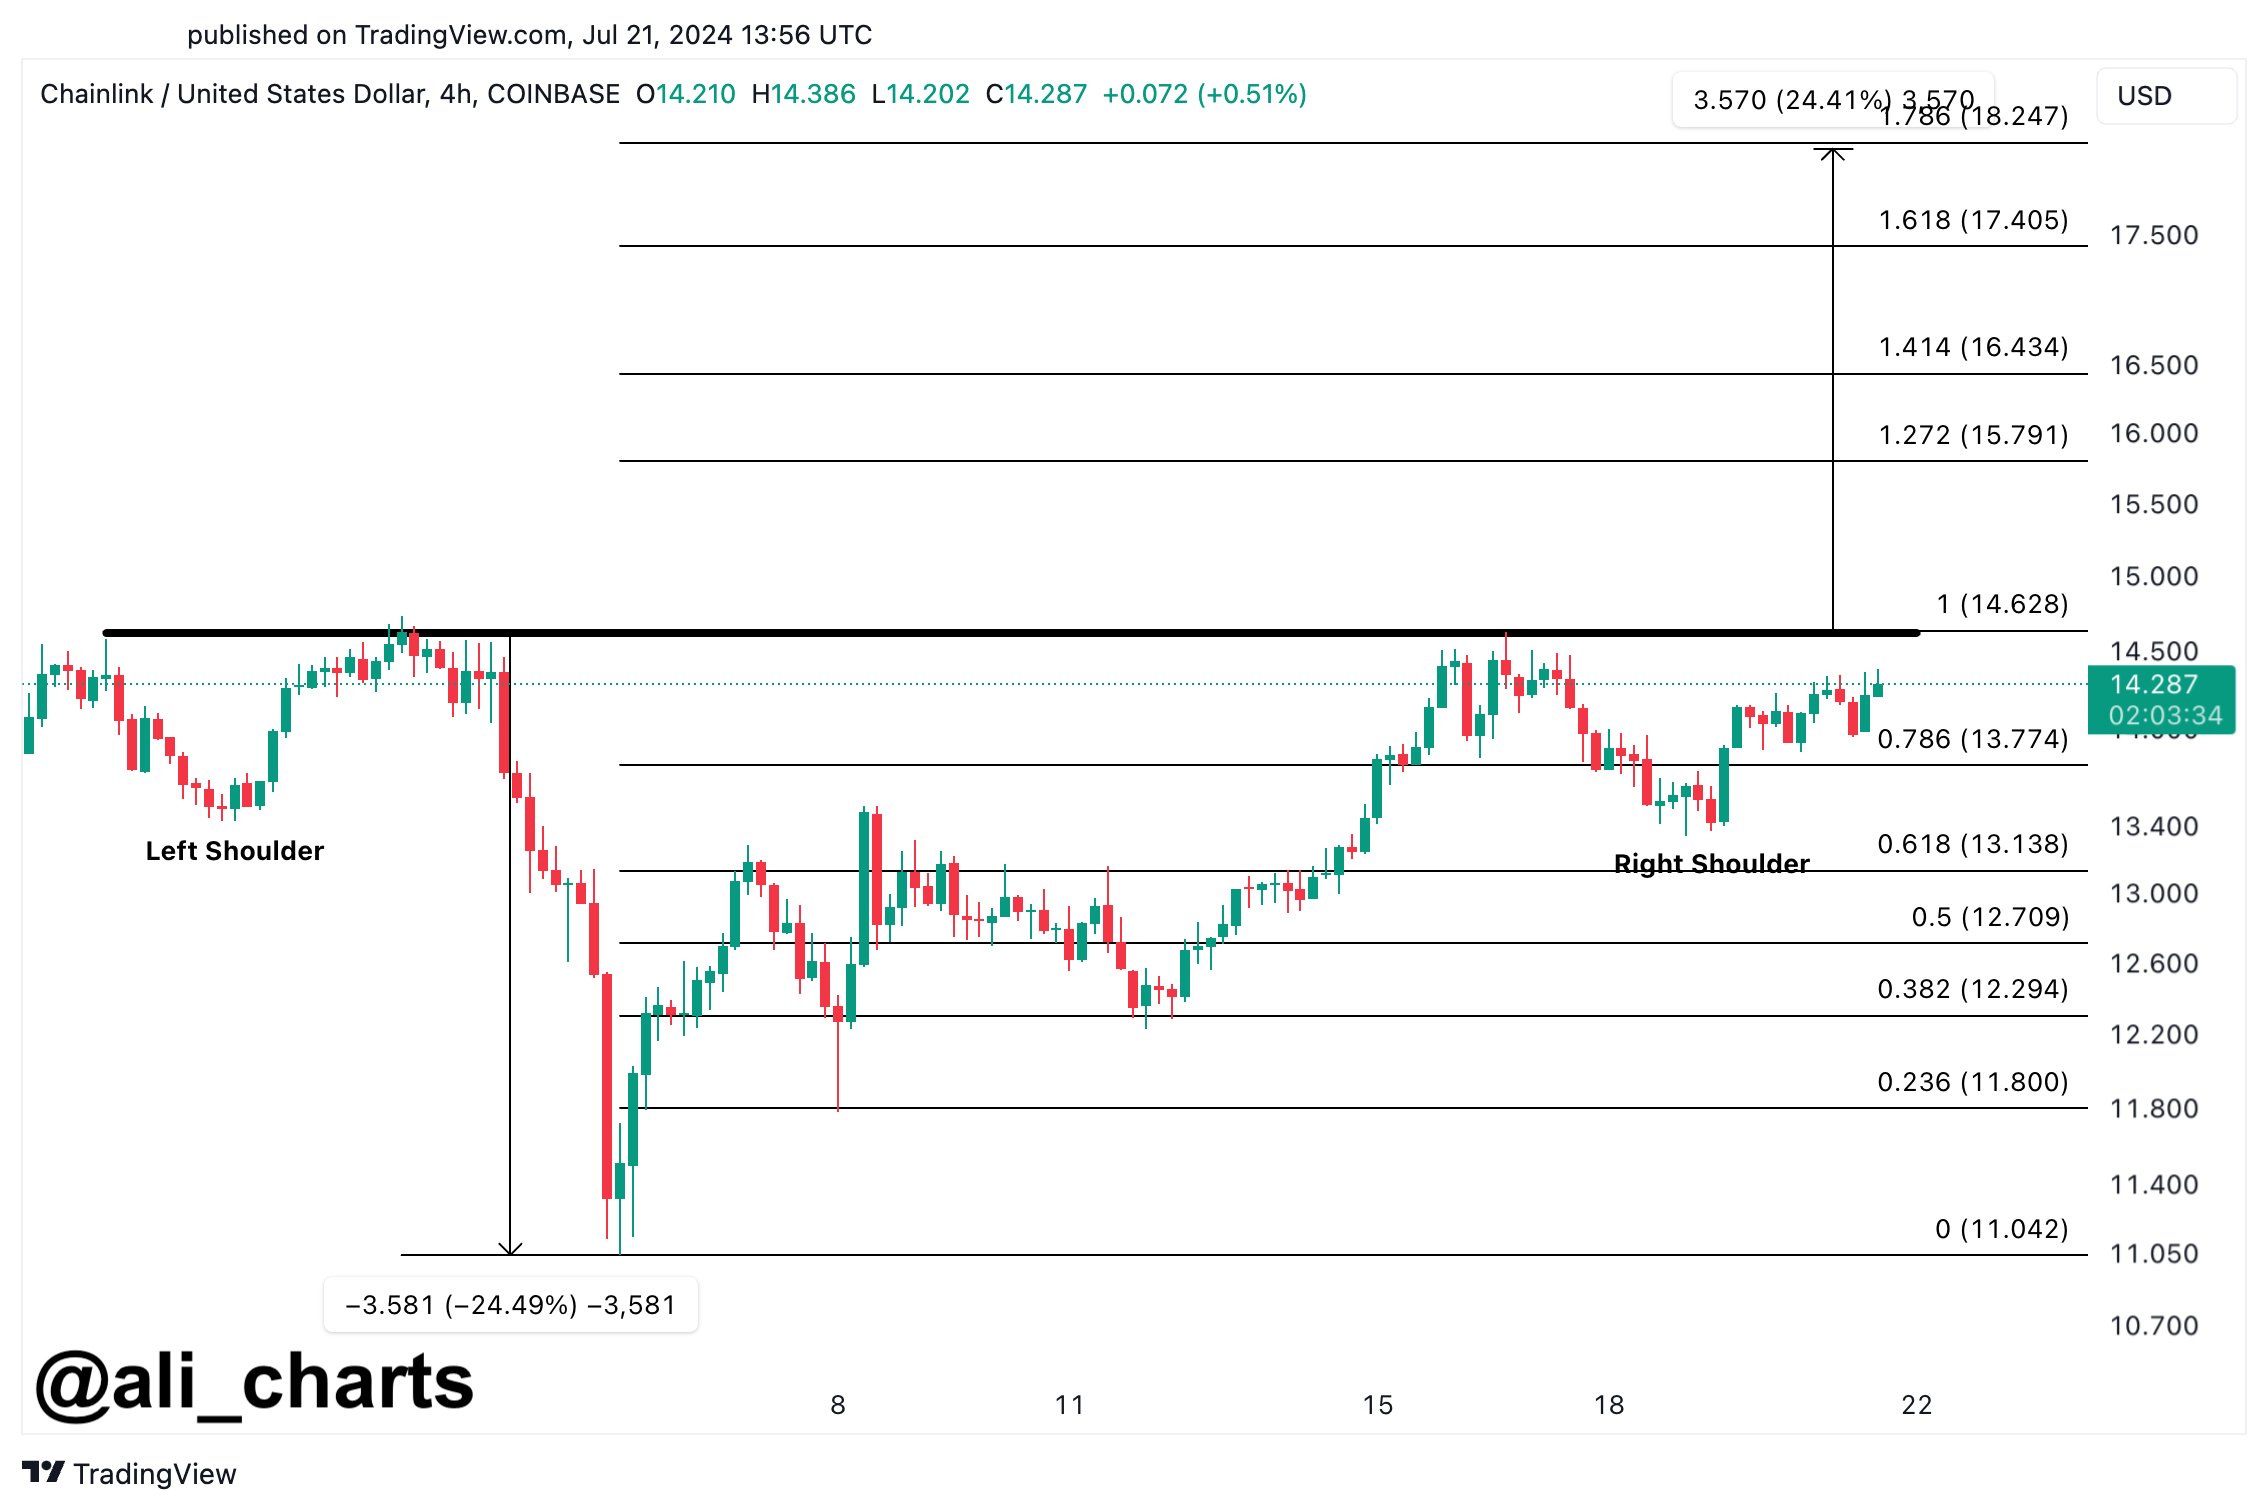
- Chainlink’s inverted head-and-shoulders and falling wedge patterns signaled a potential bullish trend reversal for eager traders.
- A close above $14.7 could propel LINK to $18.3, aligning with crucial 100-day and 200-day EMA levels.
Chainlink [LINK] has been showing signs of recovery in recent weeks. Technical analysts have identified several bullish patterns in Chainlink’s price charts, suggesting potential for further growth.
On the 4-hour chart, an inverted head and shoulders pattern has emerged. This formation is often seen as a sign of a potential trend reversal.
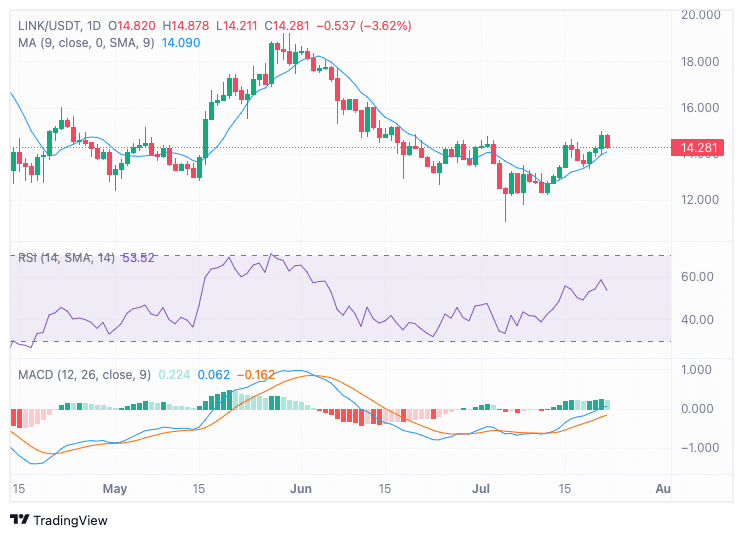
Additionally, the daily chart revealed a falling wedge pattern. This pattern typically indicates the end of a downtrend and the possibility of an upward breakout.
These technical patterns are encouraging for traders and investors looking for signs of a bullish trend.
Crypto analyst Ali has pointed out a significant price level for Chainlink. According to Ali, a close above $14.7 could potentially send LINK’s price to $18.3. He mentioned on X (formerly Twitter),
“A sustained close above $14.7 could send $LINK to $18.3!”
This price level aligned with the confluence of the 100-day and 200-day Exponential Moving Averages (EMAs). The intersection of these EMAs created a supply zone for traders, making it a crucial level to watch.
Chainlink: Current market performanceAs of press time, Chainlink was trading at $14.28, with a 24-hour trading volume of $534,913,283. This represented a 1.94% price increase in the last 24 hours and a 3.64% increase over the past seven days.
The Moving Average (MA) line, calculated over nine days, was 14.090 at press time. This indicated that the recent price was slightly above this average, suggesting a potential support level around this price.
Also, the Relative Strength Index (RSI) was 53.52, which placed it in the neutral zone. This condition was neither overbought nor oversold, suggesting that the market had a balanced sentiment towards Chainlink at the time of writing.
The RSI movement above the midline since early July indicated a gradual shift towards bullish momentum.
The Moving Average Convergence Divergence (MACD) indicator showed a positive histogram value of 0.224, with the MACD line above the signal line by 0.162, signaling bullish momentum.
The MACD lines’ crossover in early July and the positive divergence since then supported a bullish outlook.
On-chain signalsAccording to IntoTheBlock, at press time, Chainlink showed mixed results with 49% of holders being profitable, 9% at breakeven, and 43% at a loss.
Large holders controlled 69% of the supply, and the token has a strong price correlation with Bitcoin [BTC] at 0.85.
Realistic or not, here’s LINK’s market cap in BTC’s terms
On-chain signals were generally positive, with bullish indicators for “In the Money” (1.78%), “Concentration” (-0.20%), and “Large Transactions” (0.51%), while “Net Network Growth” remained neutral at 0.14%.
Exchange signals presented a mixed outlook, with a bearish “Smart Price” at 0.01% and a bullish “Bid-Ask Volume Imbalance” at 5.04%.
read more