


AMBCrypto - 6/7/2024 9:03:08 PM - GMT (+0 )

- Market sentiment around Litecoin remained bearish.
- A few metrics looked bullish, but indicators suggested otherwise.
Litecoin’s [LTC] price action has remained dormant for the last week as it didn’t move much. However, the trend can change as LTC broke above a bullish pattern.
If the coin tests that pattern, then investors might witness explosive growth in the coming weeks.
Litecoin prepares for a rallyCoinMarketCap’s data revealed that LTC’s price only moved marginally in the last seven days. At the time of writing, Litecoin was trading at $84.48 with a market capitalization of over $6.3 billion, making it the 20th largest crypto.
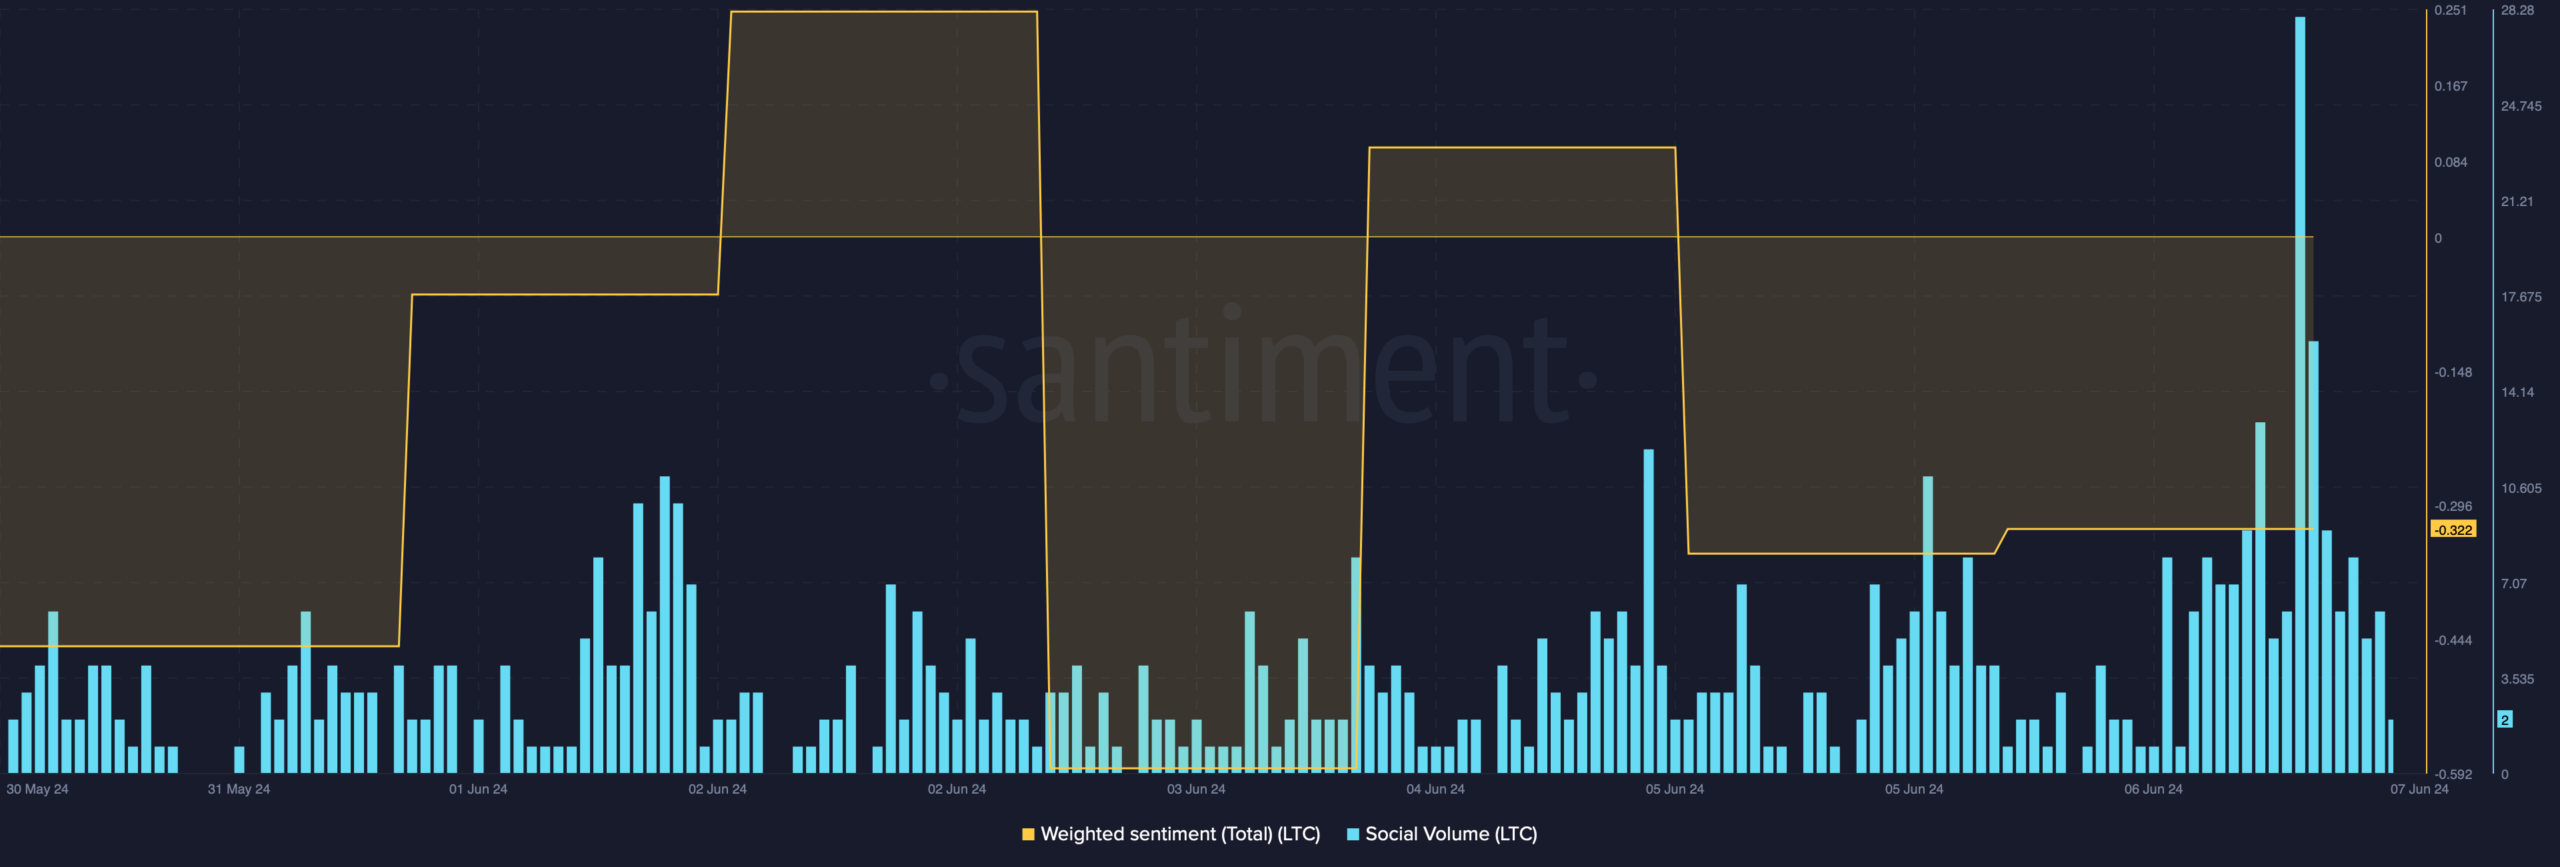
The sluggish price action also had a negative impact on LTC’s market sentiment.
AMBCrypto’s analysis of Santiment’s data revealed that LTC’s weighted sentiment remained in the negative zone. Its social volume also remained, except for a spike on the 7th of June.
But things can turn volatile soon.
World Of Charts, a popular crypto analyst, recently posted a tweet highlighting an interesting development.
As per the tweet, LTC’s price broke above a bullish pennant pattern, which might allow the coin to touch $120 in the coming weeks.
LTC’s price entered the pattern in March and since then has been consolidating inside it.
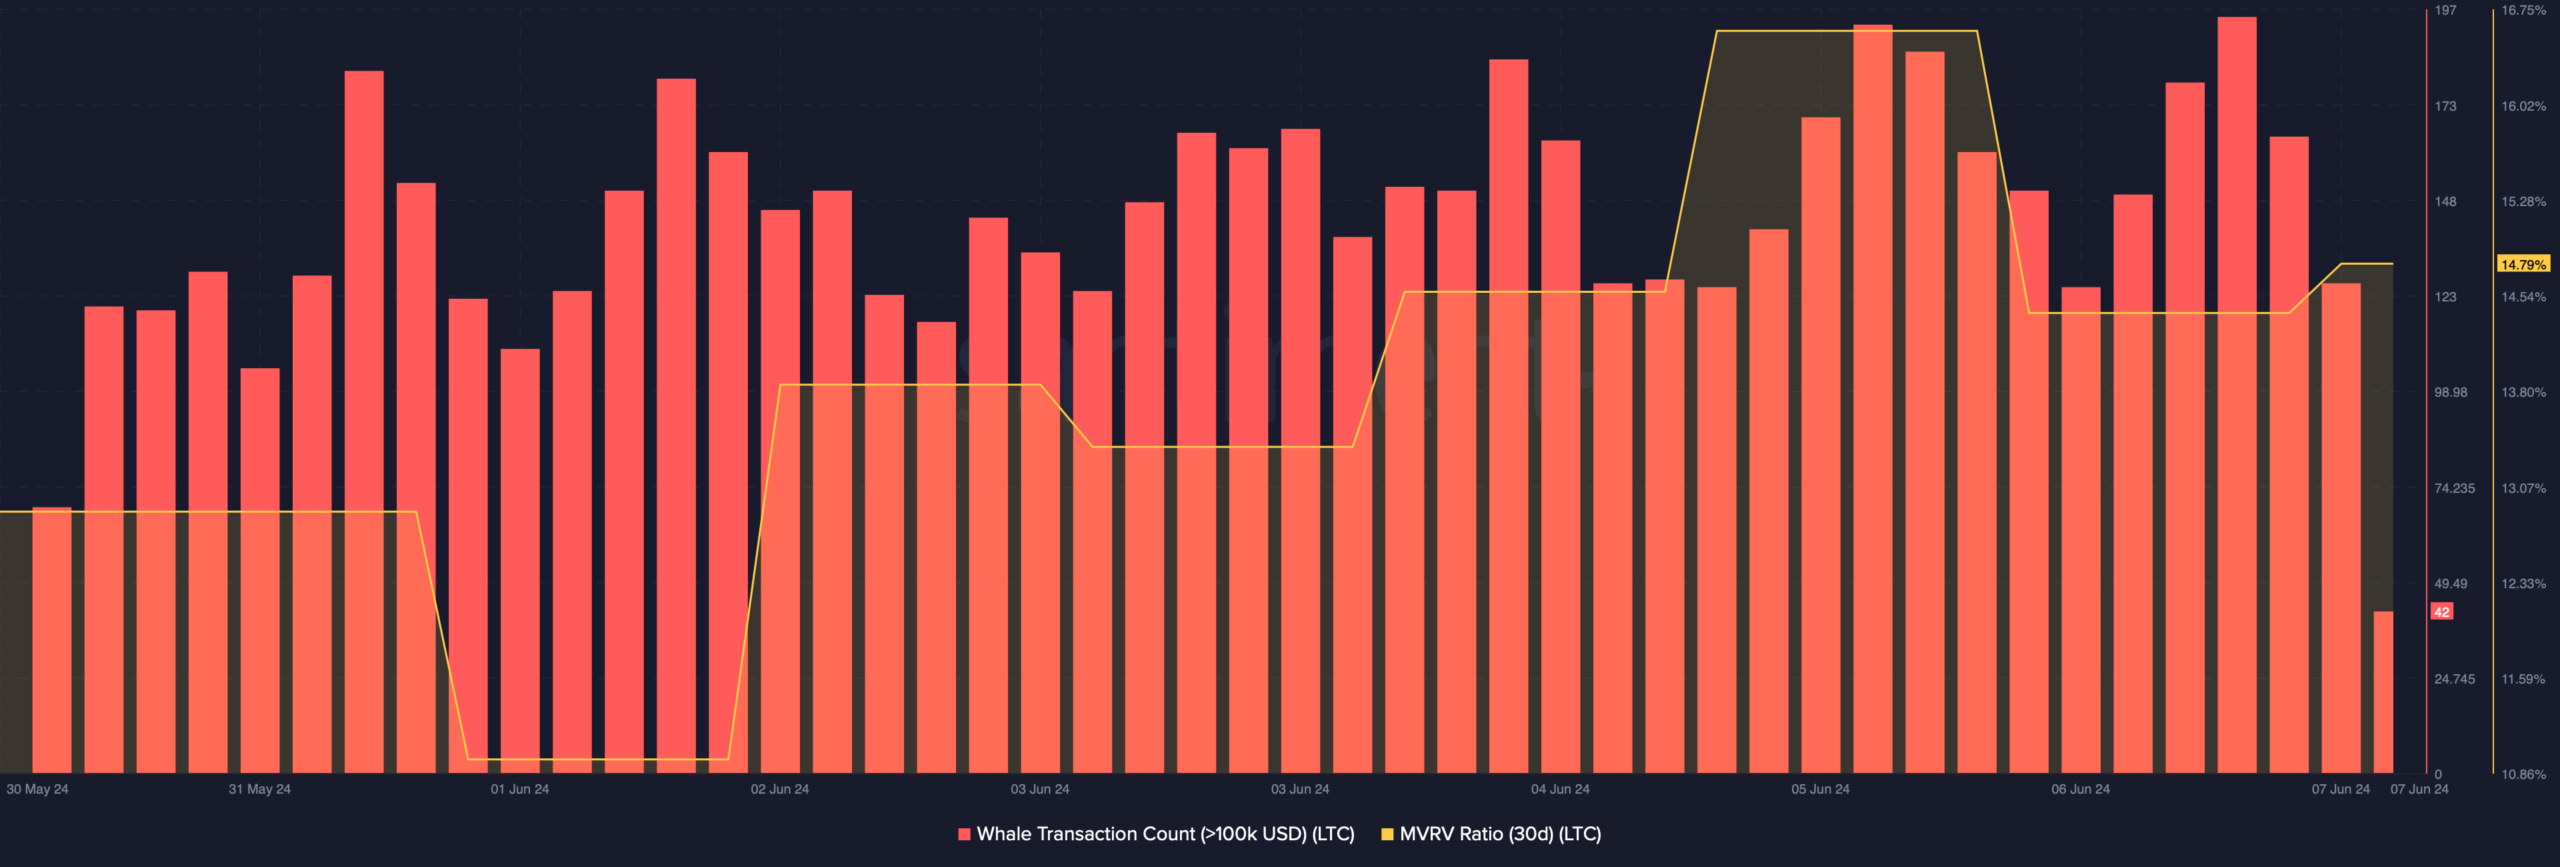
Odds of an LTC bull rally are…Since LTC showcased a bullish breakout, AMBCrypto then analyzed the coin’s on-chain metrics to see how likely it is for LTC to turn explosive.
As per our analysis, whale activity around the coin remained substantially high throughout the last week. Additionally, its MVRV ratio also increased, which was bullish.
At press time, the MVRV ratio had a value of 14.79%.
Moreover, LTC’s fear and greed index had a value of 46% at press time, meaning that the market was in a neutral phase. Whenever the metric reaches that level, it indicates that things might get volatile soon.
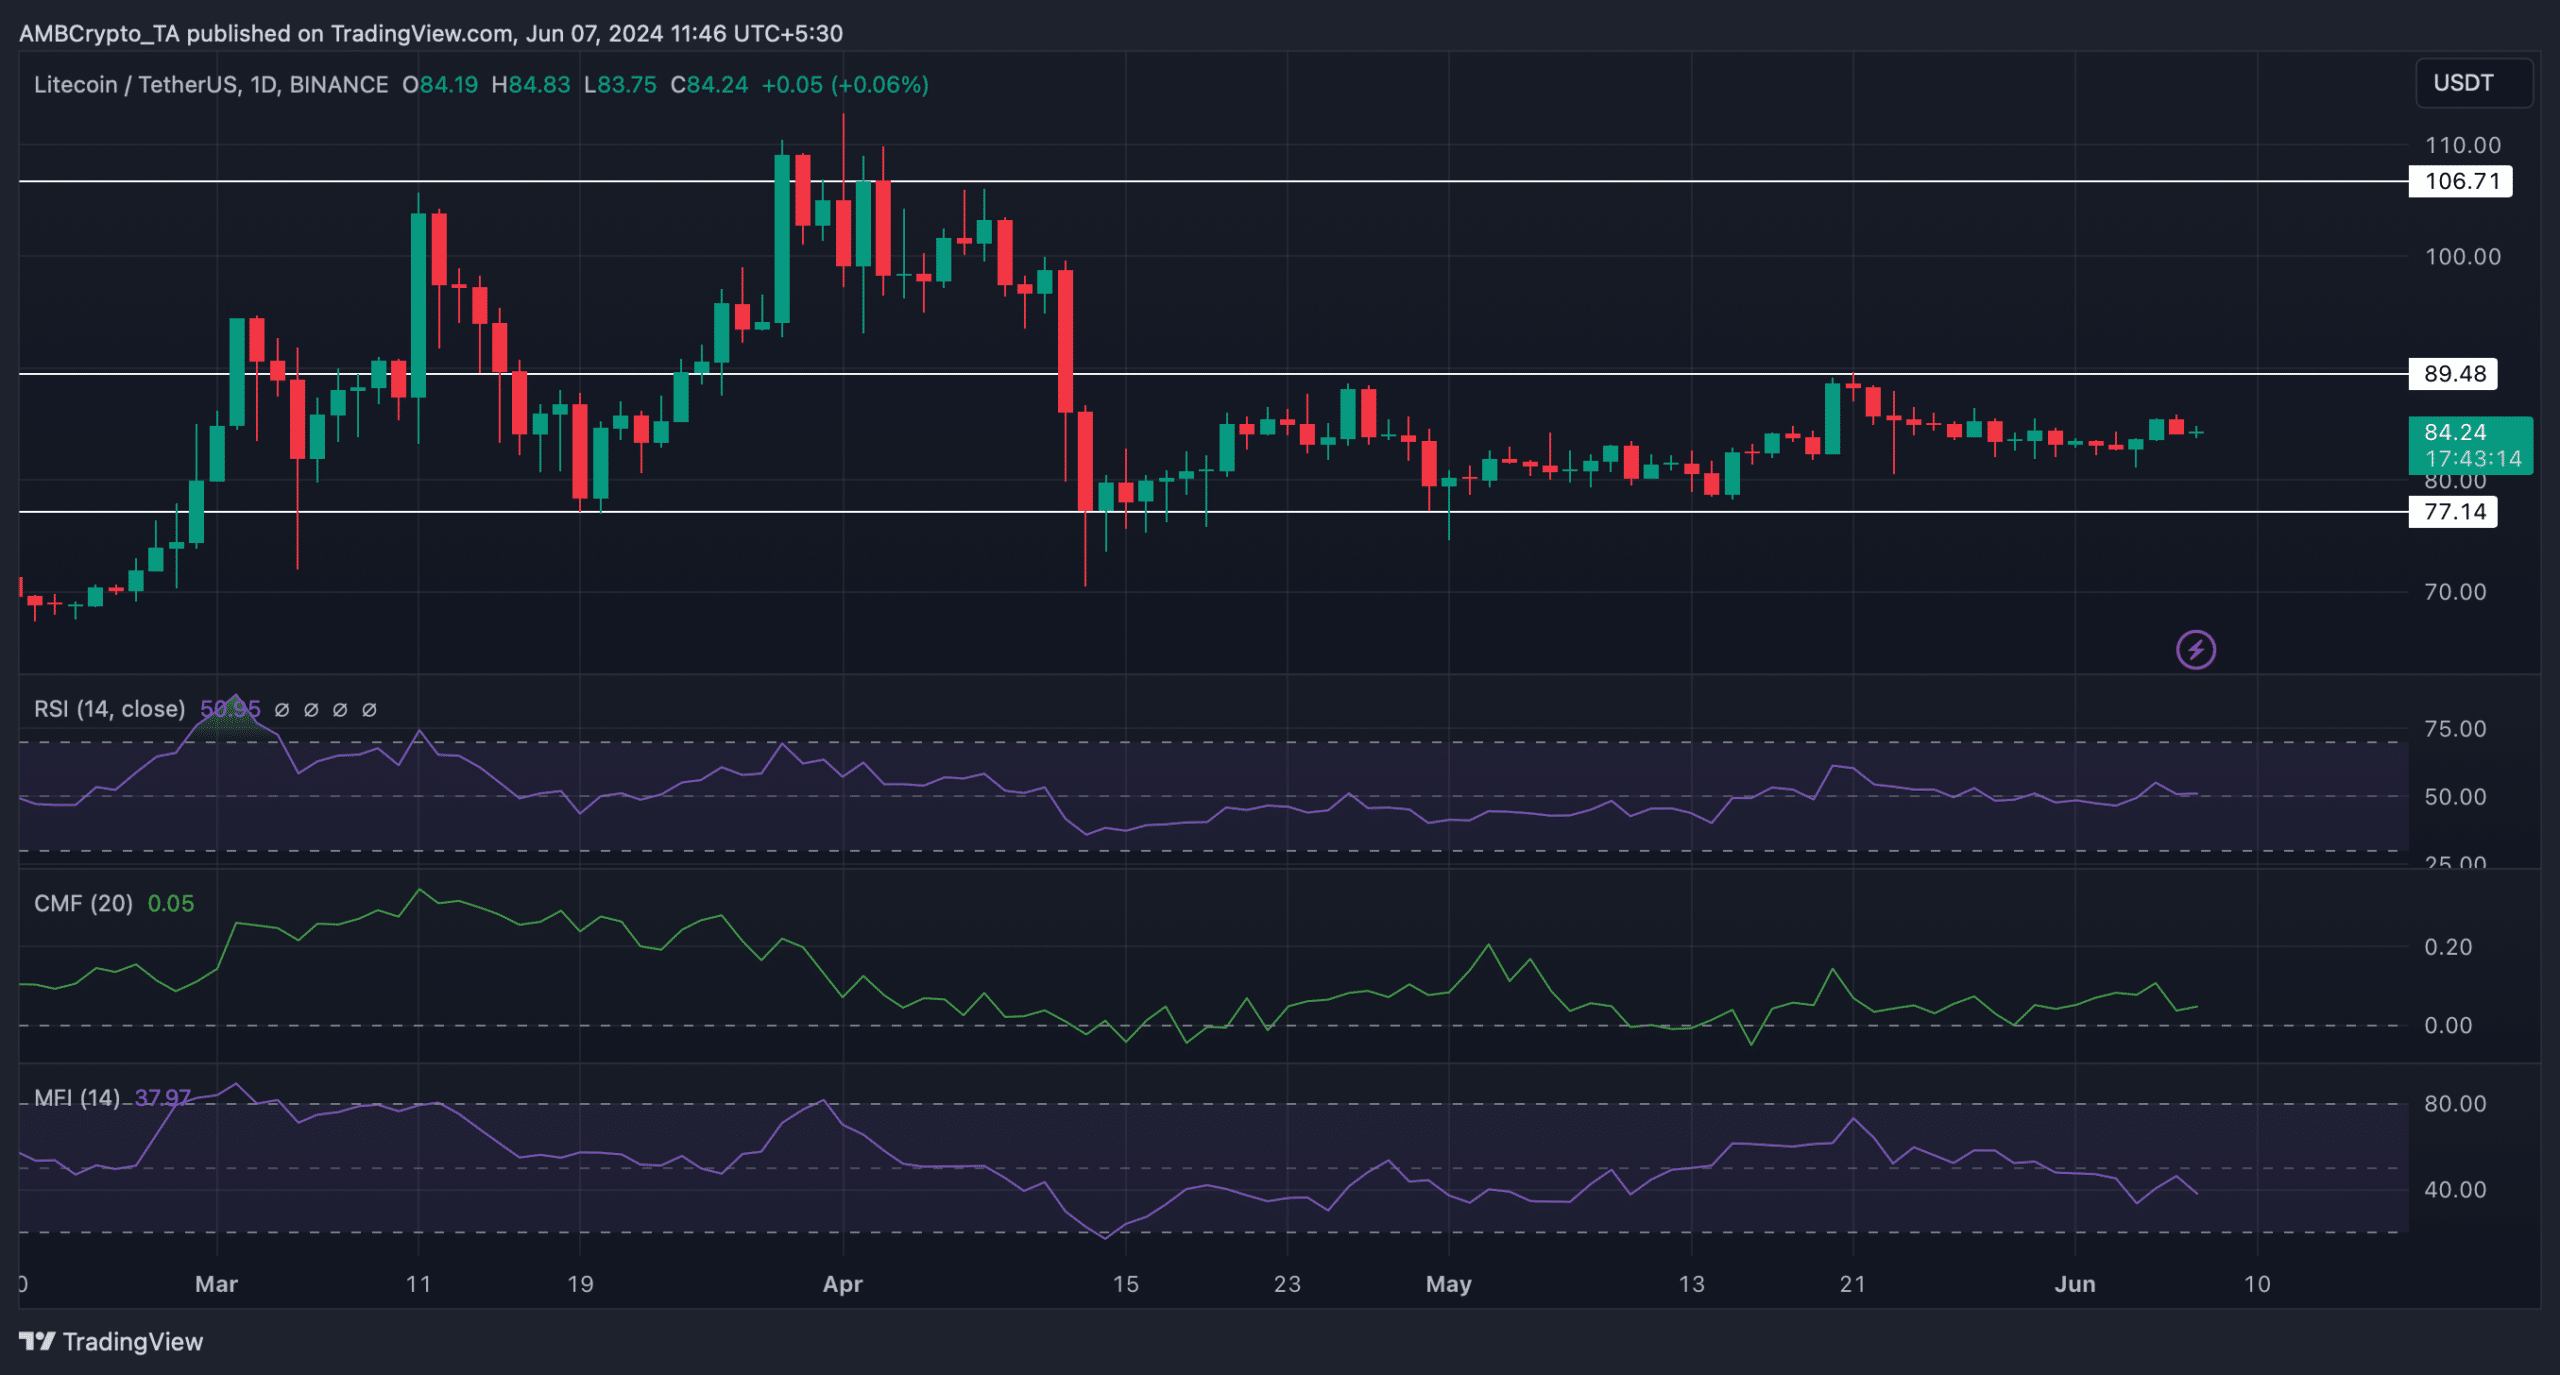
We then took a look at Litecoin’s daily chart to better understand what to expect. In order to touch $120, it is crucial for LTC to go above its resistance at $89.48.
A successful breakout above that level could allow LTC to reclaim $106 before it reaches $120. We found that its Chaikin Money Flow (CMF) registered a slight uptick from the neutral mark, hinting that it’s likely for LTC to turn bullish.
Realistic or not, here’s LTC’s market cap in BTC terms
However, the rest of the indicators suggested that it might take a bit longer for LTC to turn volatile.
For example, its Money Flow Index (MFI) registered a downtick. Its Relative Strength Index (RSI) was also resting at the neutral mark.
read more