


Looking back at previous instances when Ethereum’s MVRV ratio entered the “red box” zone, the aftermath has often been grim.
The most notable peak occurred in late 2021, followed by a sharp decline that wiped out nearly all the accumulated gains.
Similarly, the ratio’s approach to overvaluation territory in mid-2022 also triggered a steep correction, dragging ETH prices down significantly.
Each time the MVRV ratio flirted with these upper limits, the market responded with pronounced selling pressure. The pattern could imply that Ethereum’s current uptrend might soon face a challenging test.
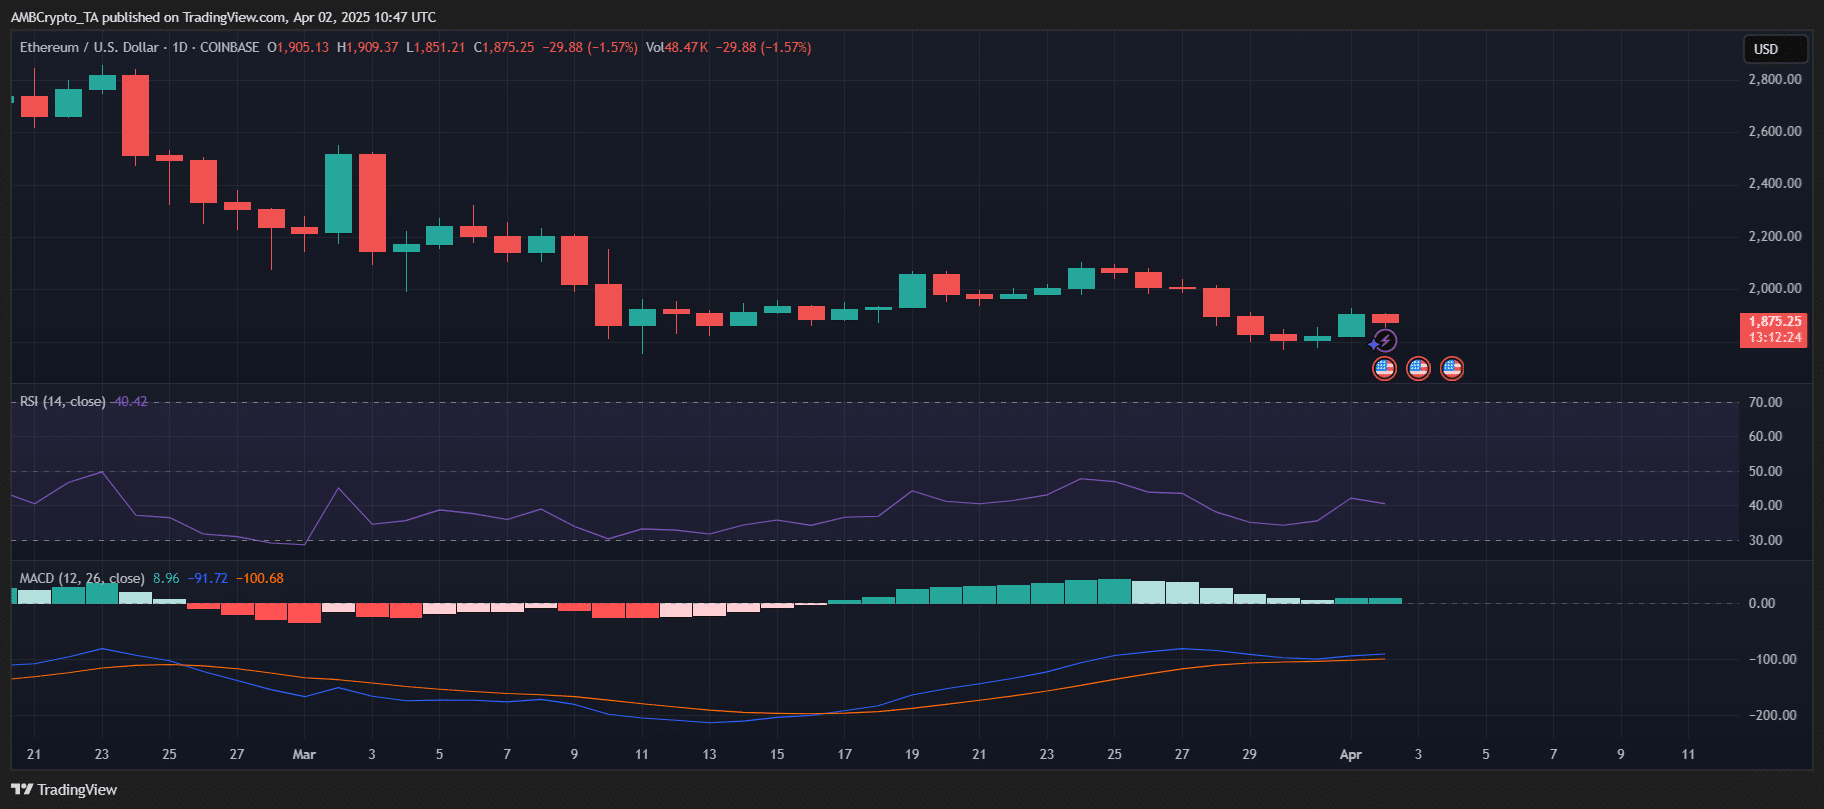
Is Ethereum due for a pullback?Ethereum hit $1,875 at press time, reflecting a 1.57% decline on the daily chart. The RSI was hovering at 40.42, signaling that ETH was approaching oversold territory, which could limit further downside.
However, the MACD histogram remained in the negative, indicating bearish momentum despite a slight reduction in selling pressure.
The recent series of red candles suggests that bulls are struggling to regain control. Should the selling persist, ETH could test the $1,800 support level.
Conversely, a rebound above $1,900 might encourage buyers to push toward the $2,000 resistance.