


AMBCrypto - 6/9/2020 3:32:24 PM - GMT (+0 )
Disclaimer: This analysis will be attempting to foresee changes in Ethereum’s price charts up to the 3rd week of June.
The last 7 days have been rather exciting for Ethereum, with the world’s 2nd largest digital asset continuing to outperform Bitcoin on a weekly basis. In fact, the crypto-asset spiked by 26.15 percent between 27 May and 2 June, as the price went on to touch $252 on the charts.
However, a quick pullback soon followed, bringing the price of ETH down to $225 briefly. Alas, at the time of writing, the crypto-asset was back to being priced above $240.
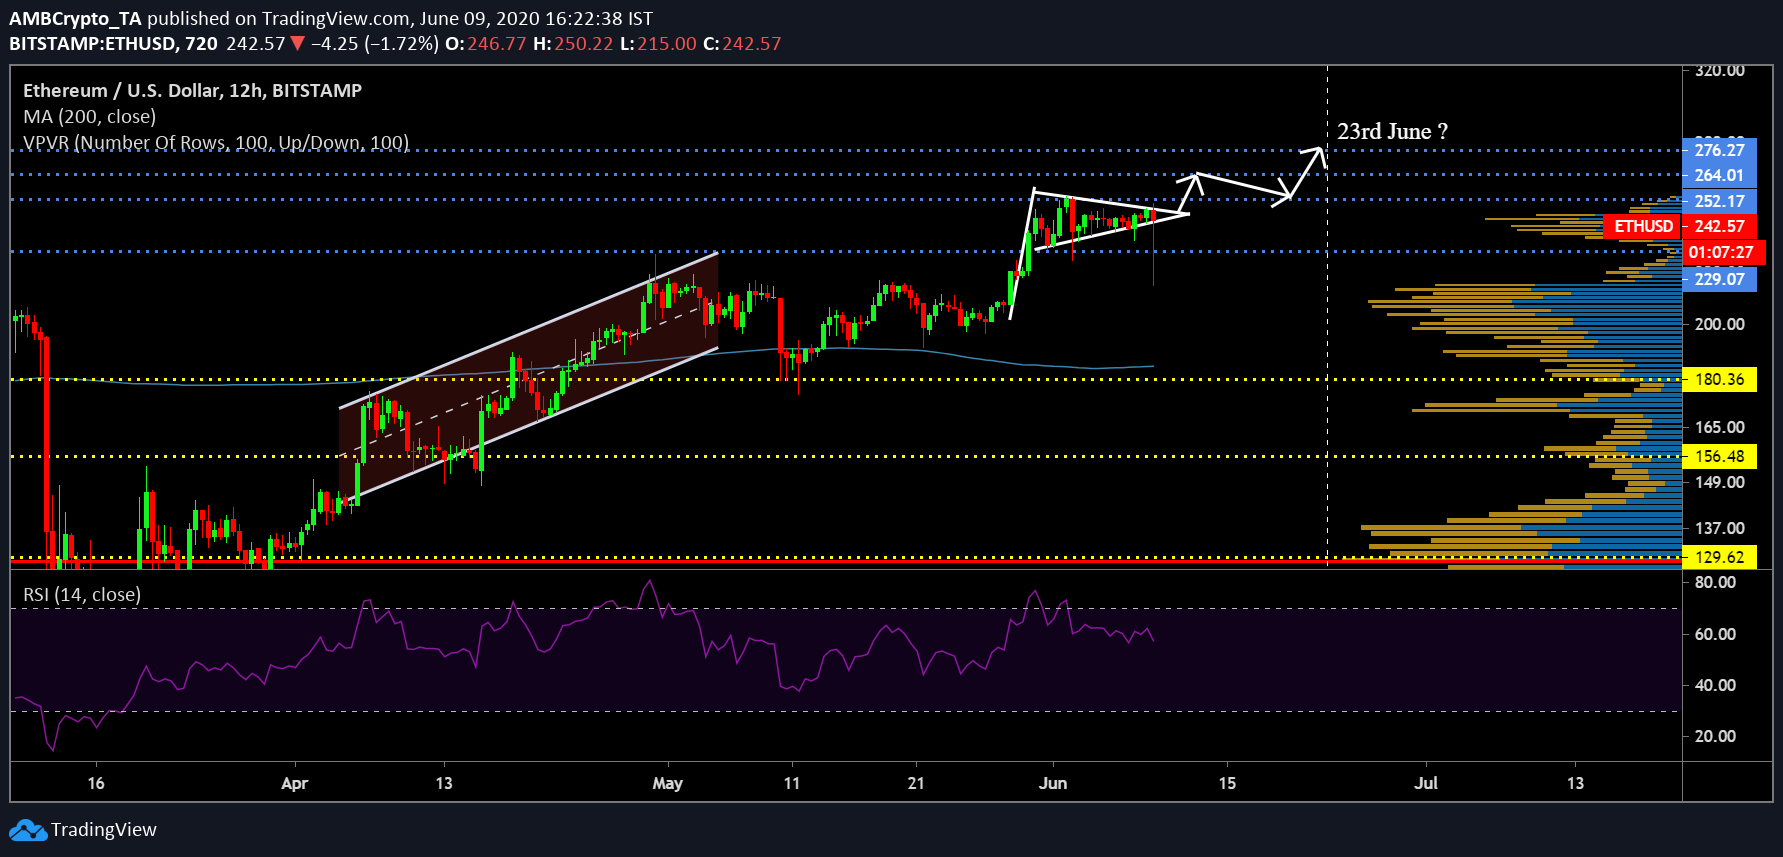
Ethereum 12-hour chart
Source: ETH/USD on Trading View
Ethereum’s 12-hour chart pictured two patterns that have taken shape since the start of April. After an ascending channel that continued for the entirety of April, a correction period pulled ETH below $200. Since then, the crypto-asset has recouped its higher range. At press time, Ethereum’s price charts were seeing the formation of a bullish pennant that was nearing a breakout.
Considering another rally breaks out for Ethereum, the crypto-asset might successfully surpass its resistance at $252 and embark on its next target at $264. However, the long-term target remains $276 for the world’s largest altcoin.
Further, while the VPVR suggested the absence of a strong trading range at the press time price point, the Relative Strength Index or RSI continued to picture an upper hand for the buyers over the sellers in the market.
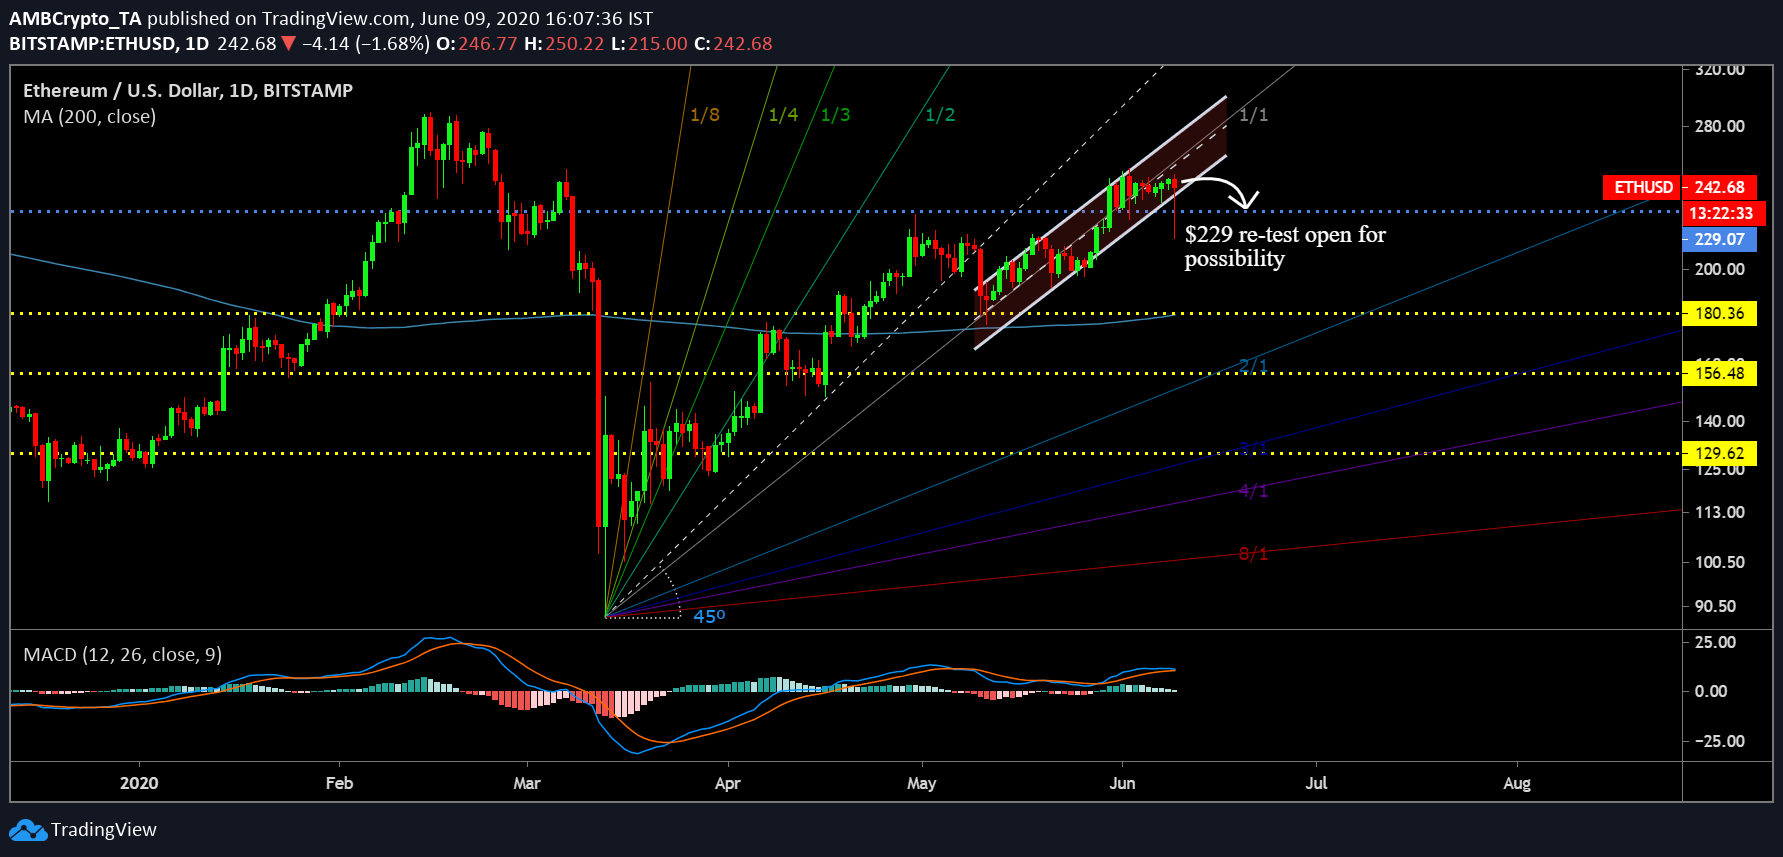
Is a re-test possible as well?
Source: ETH/USD on TradingView
One drawback of the bullish pennant is that it only pans out around 40 percent of the time on the charts. Hence, on observing the 1-day chart for Ethereum, we observed that a re-test at $229 cannot be dismissed as well.
According to the Gan Fann, Ethereum’s in a game of tug-of-war between the bears and bulls at press time, as described by the ebb and flow movement between the 1/1 line. The sentiment remains widely divided, but at the time of writing, Ethereum’s valuation was consolidating under the 1/1 line. Technically, what looks to be a bearish trend, is backed by the fact that the price is also navigating within an ascending channel, something that might facilitate a short pullback.
Thus, a drop down to $229 is quite possible if a bearish outcome takes place on account of this analysis. Further, the MACD line maintained close proximity with the signal line, highlighting the high probability of a trend reversal.
Conclusion
Although a clearer picture will be attained in the future, for the time being, bulls seem to have higher momentum going forward and a continuation of this sentiment will manifest a return above $250 and $260.
Your feedback is important to us!
read more