


AMBCrypto - 7/25/2024 6:02:51 PM - GMT (+0 )

- Bitcoin has a bearish structure on the weekly chart.
- The recent losses might be reversed next week, but it is unclear if the bulls can drive prices beyond $69k.
Bitcoin [BTC] prices fell by another 2.2% on Thursday, the 25th of July, and the daily trading session is not over yet. Since Monday, Bitcoin has fallen by 5.84%. The breakout past $60k was hailed as important, but it appeared the price could be headed toward it once again.
While Bitcoin does not need a reason or news event for prices to trend one way or another, the recent losses have a plausible reason. So, why is Bitcoin down today?
Liquidation levels indicate BTC might move toward $69k next week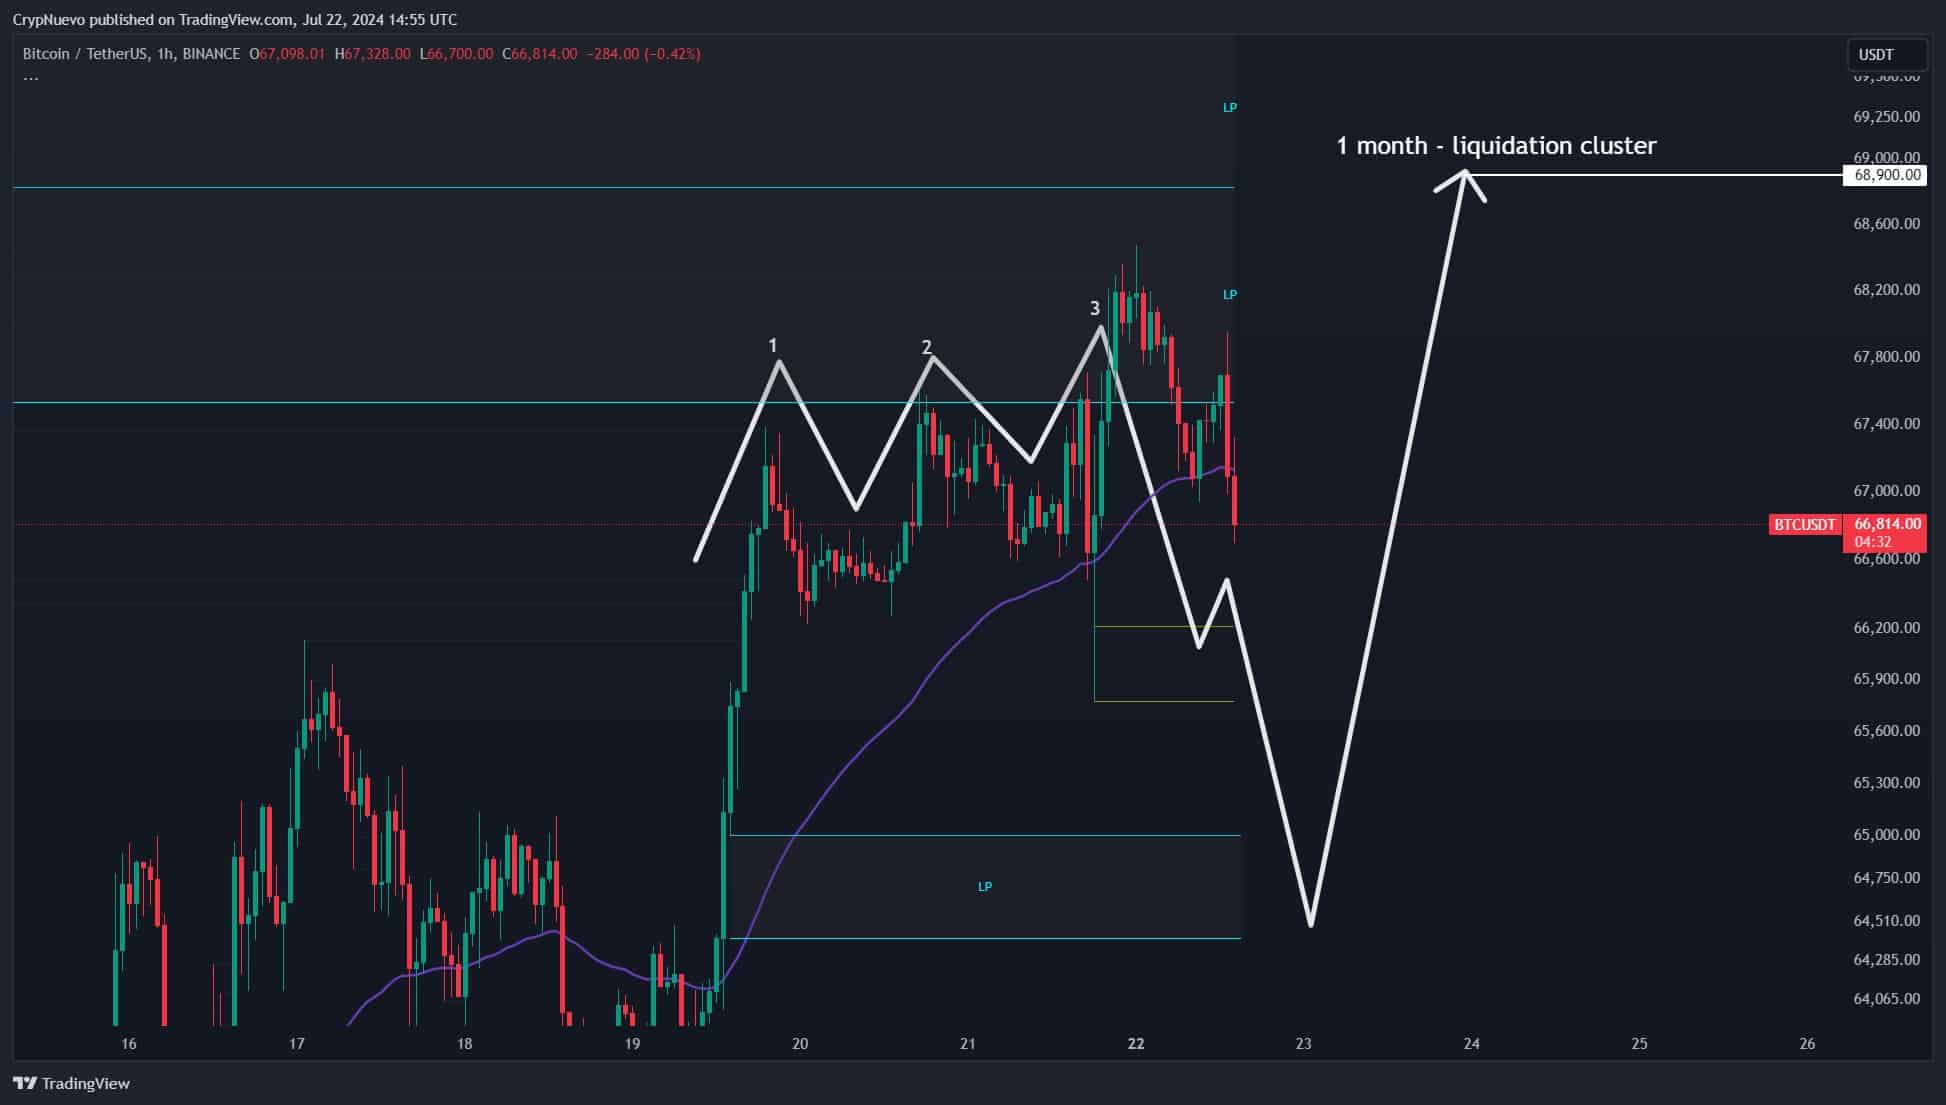
Source: CrypNuevo on X
In a post on X (formerly Twitter) crypto analyst CrypNuevo laid out a prediction that Bitcoin prices would fall toward $64.5k. This was because of the liquidity pool in this area on the lower timeframes.
It was likely to attract prices toward it, and his prediction has been right thus far. At press time, BTC was exchanging hands at $64.2k. He also predicted that it would bounce toward $68.9k.
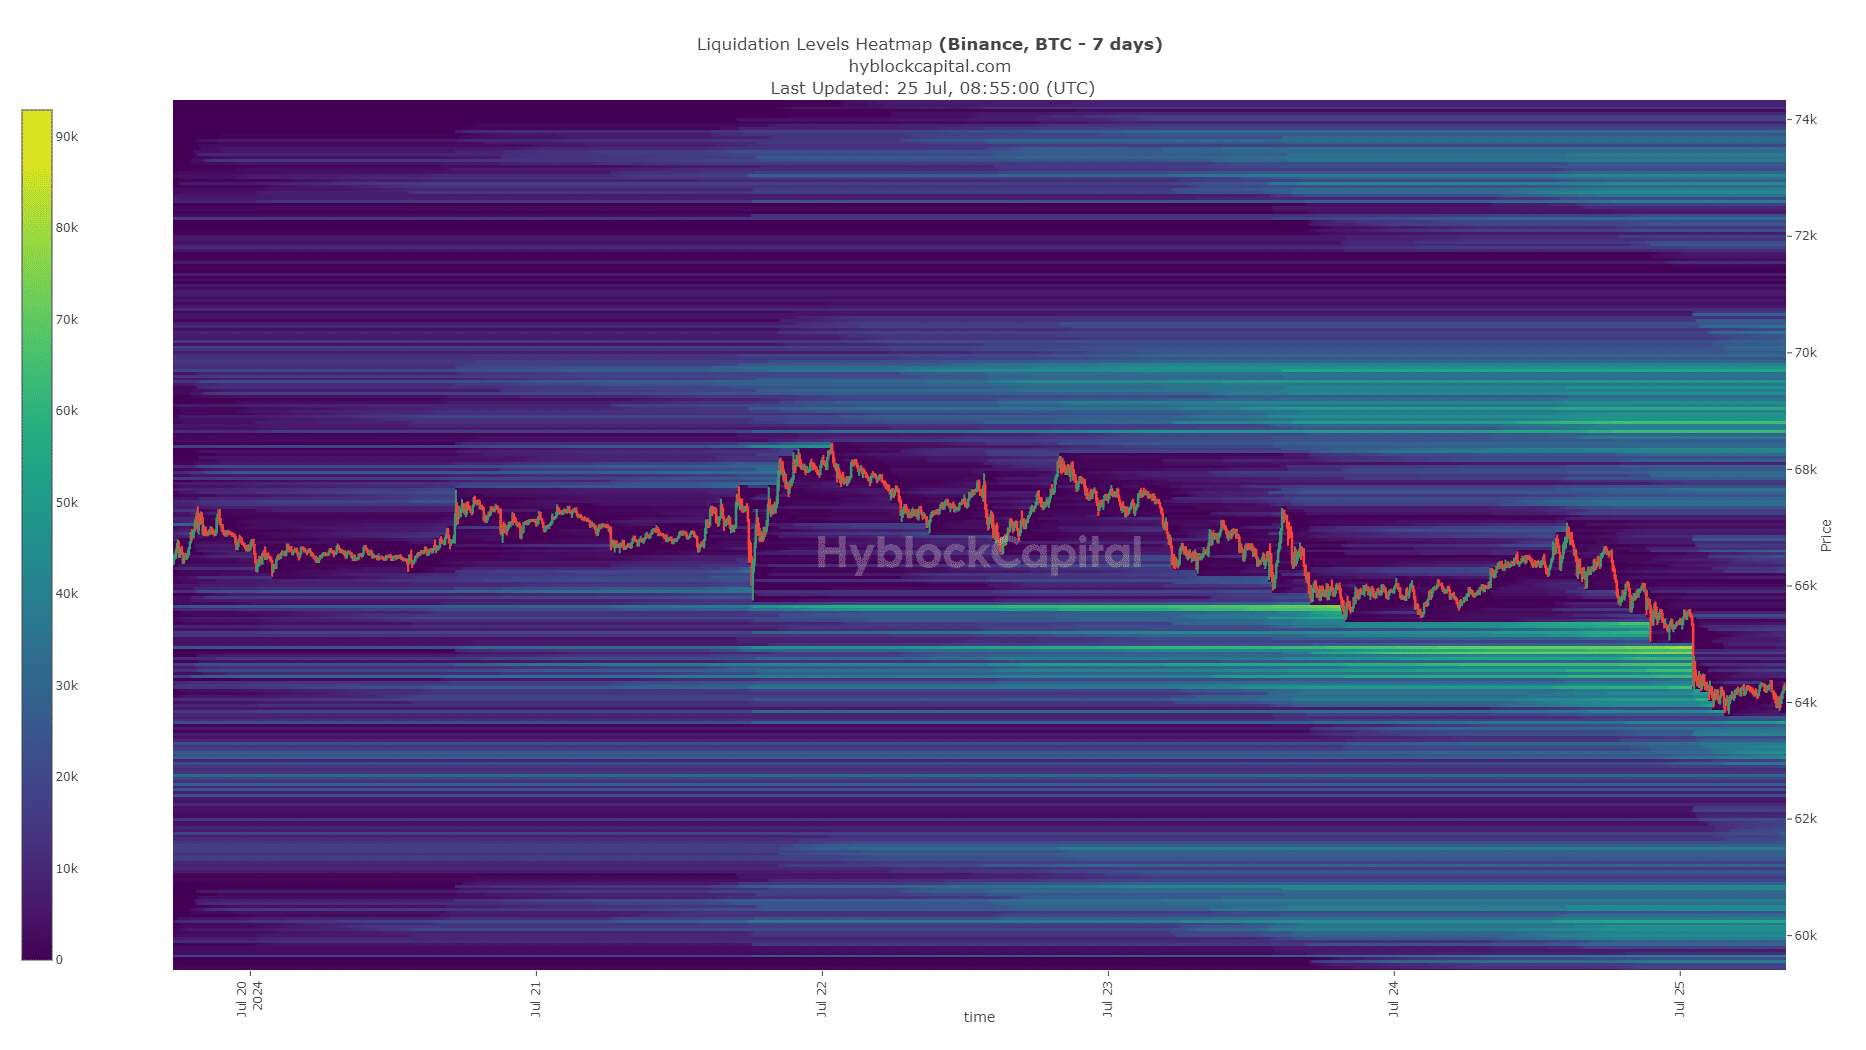
Source: Hyblock
AMBCrypto looked at the 7-day liquidation heatmap and observed that the $64k-$64.8k zone was a cluster of liquidation levels.
As the analyst had pointed out on the 21st of July, Sunday, a retracement to these levels in search of liquidity was feasible.
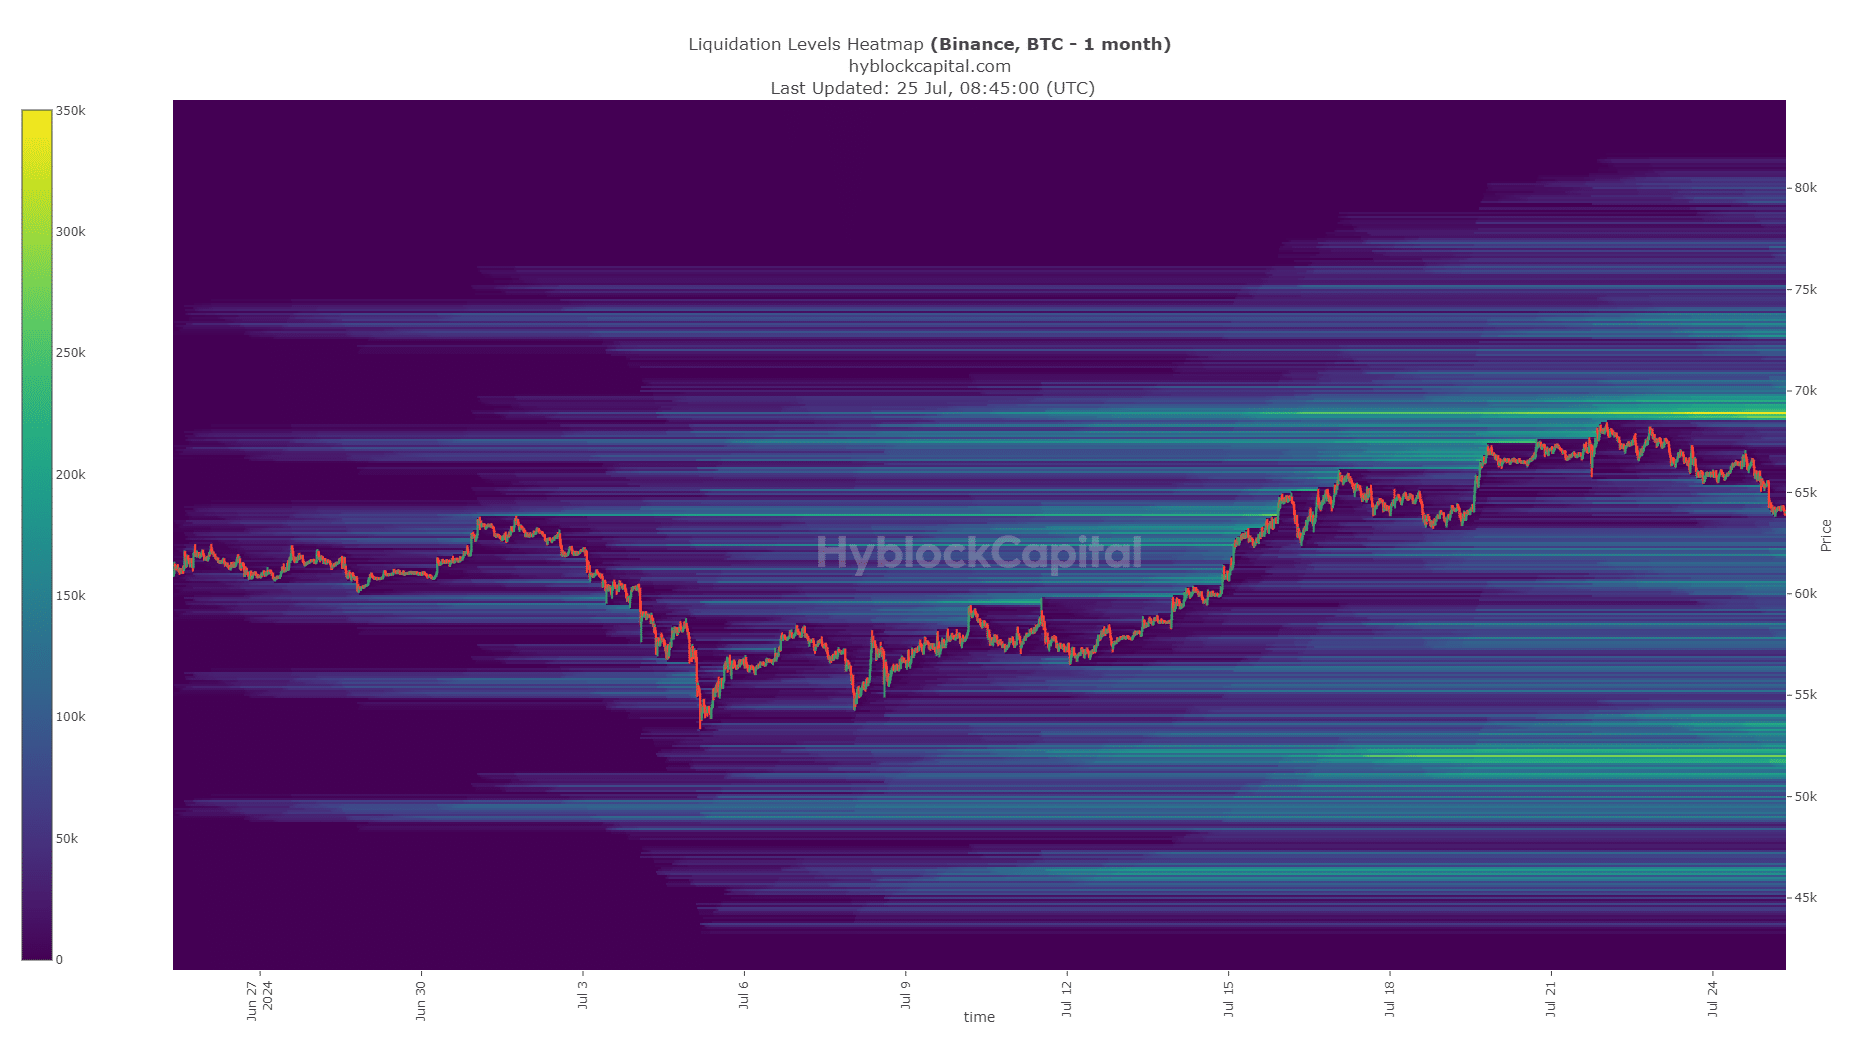
Source: Hyblock
While that helps explain why Bitcoin is down today, AMBCrypto looked at the 1-month chart to understand where prices could go next. To the north, the $69k level was bright with liquidation levels and is likely to attract prices to it.
Disturbingly, the $52k and $46k levels also had a clump of liquidation levels. These levels could get denser over the coming days, making it more likely BTC would test them.
The weekly chart hints at a continuation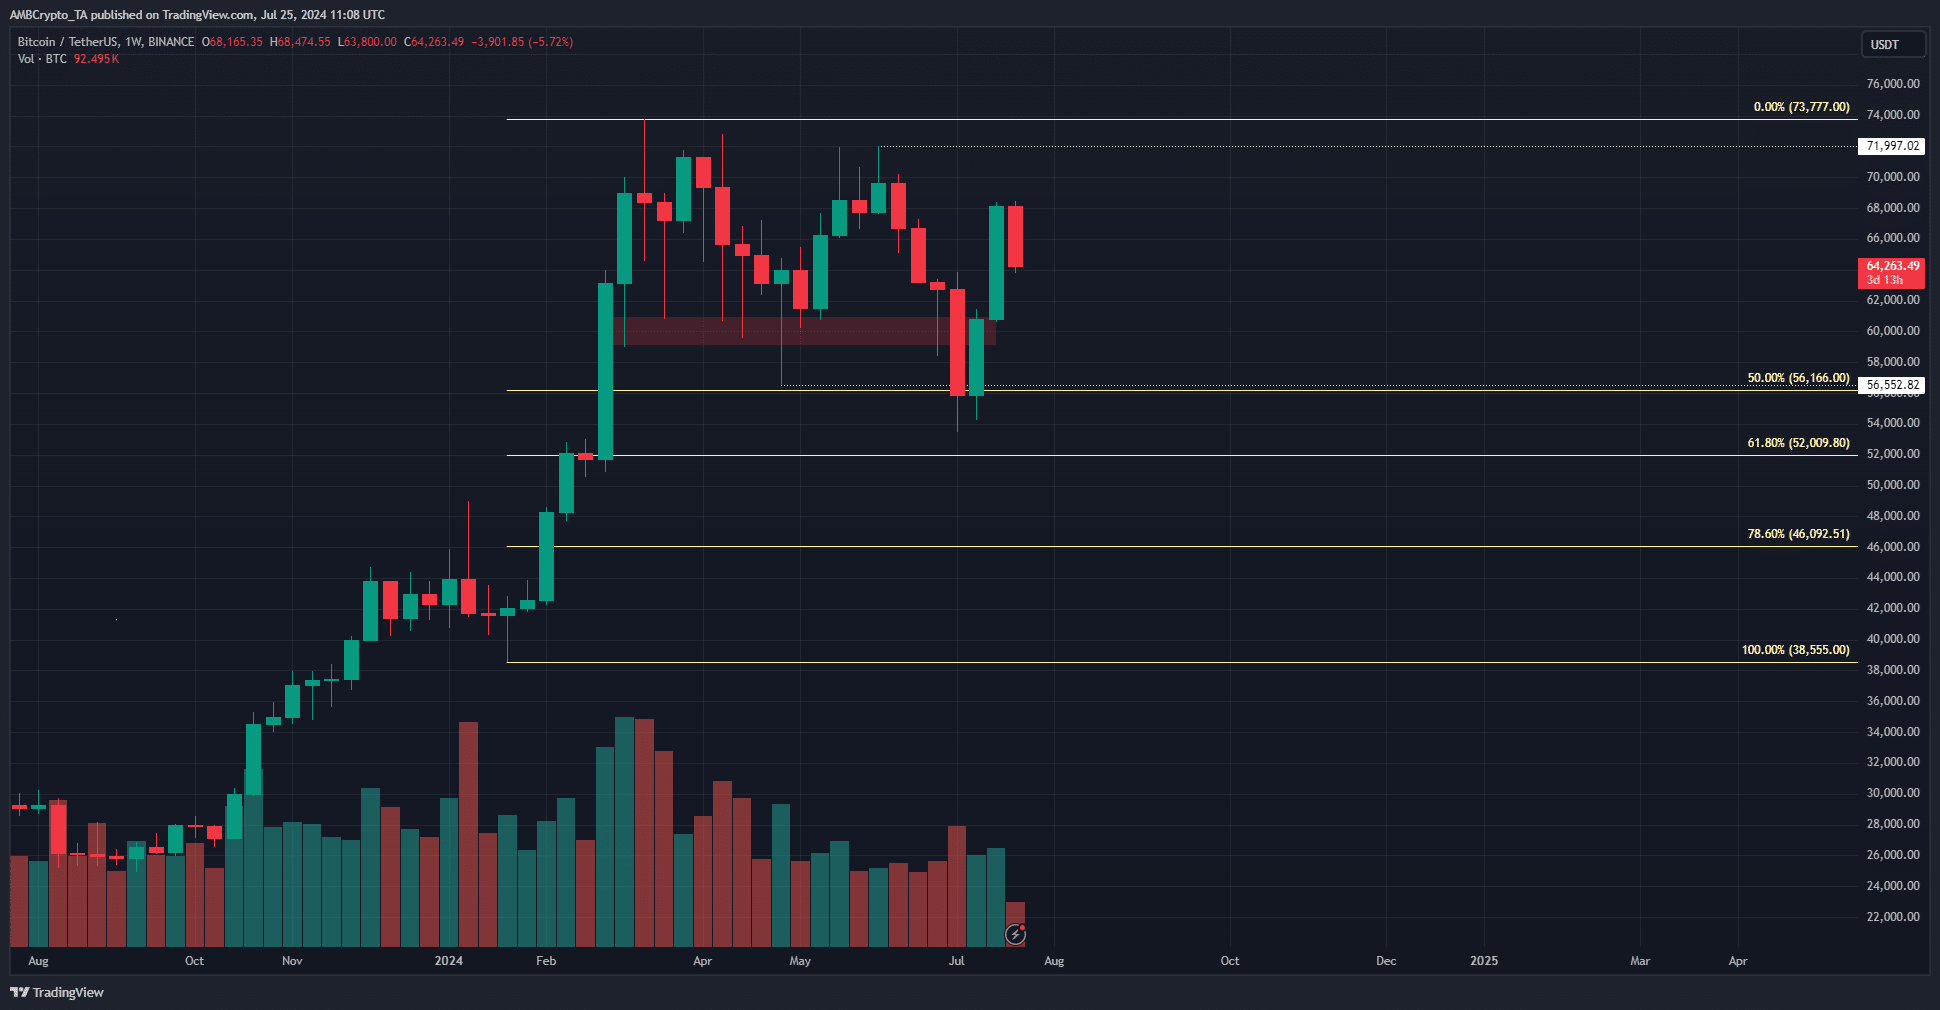
In a post on X, Trader Mayne, a popular crypto trader, pointed out that the weekly structure was still bearish. It became bearish after the higher low from April at $56.5k was breached in early July.
Read Bitcoin’s [BTC] Price Prediction 2024-25
Meanwhile, the local high at $72k was not visited or broken in the 1-week timeframe, which indicated that a bearish swing might be in play. This could be bad news for long-term holders.
The Fibonacci retracement levels showed the $52k and $46k levels, which were also liquidity pools, were the 61.8% and 78.6% retracement levels.
read more