


Coingape - 6/29/2020 2:14:35 PM - GMT (+0 )

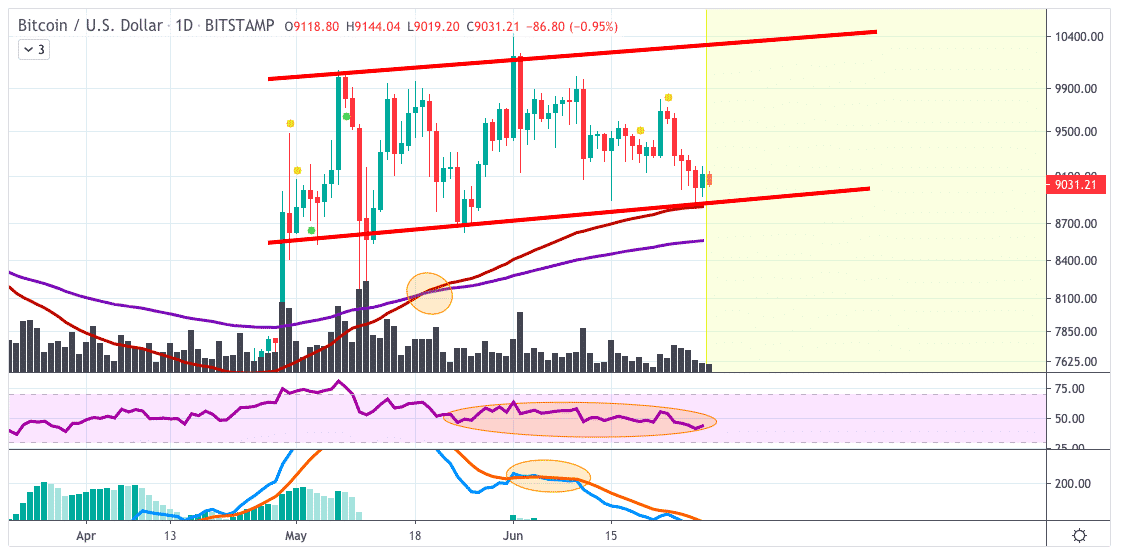


BTCUSD price has found support at the 200-EMA which is a good sign and also it provided a bullish EMA crossover in the past which is holding the trending up.
BTCUSD Price Analysis: 1 D Chart BTCUSD Price AnalysisFor now, BTCUSD is forming this huge parallel channel where it has the possibility to form a bullish flag when the flag confirms to the upside.
The volume is decreasing which means it can increase in volume and volatility soon. After the trend has confirmed we will see how bullish BTCUSD really is. The RSI is sending moderate signs where it is consolidating in the middle line this can
mean it will visit the oversold or overbought region when the price is trending.
The MACD shows some mixed signs where it confirmed a bearish crossover but this was not really valid because the MACD is slinging in one and another.
- TREND: Sideways, support found
- FORMATION: Possible Bull-Flag
- EXPECTATION: Breakout
- PREV: 9009.30
- OPEN: 9008.33
- VOLUME: 3.073K
- DAY’S RANGE: 8933.06 — 9191.72
Disclaimer The views, opinions, positions or strategies expressed by the authors and those providing comments are theirs alone, and do not necessarily reflect the views, opinions, positions or strategies of CoinGape. Do your market research before investing in cryptocurrencies. The author or publication does not hold any responsibility for your personal financial loss.
Vince is an experienced trader, investor and financial analyst within the markets in which he concentrates on the cryptocurrencies and decent opportunities within them to trade in a professional oriented manner. You can follow him at trading view market insight at: https://www.tradingview.com/u/VincePrince/
Or you can join his telegram channel: https://t.me/vinceprince_channel
read more