





Coindoo - 8/5/2026 3:11:43 PM - GMT (+0 )


- 5 August 2026
- |
- 18:09
Ethereum has spent six sessions testing resistance near $1,870. With futures leverage still elevated, a break above $1,917 or below $1,850 could trigger a sharper move.
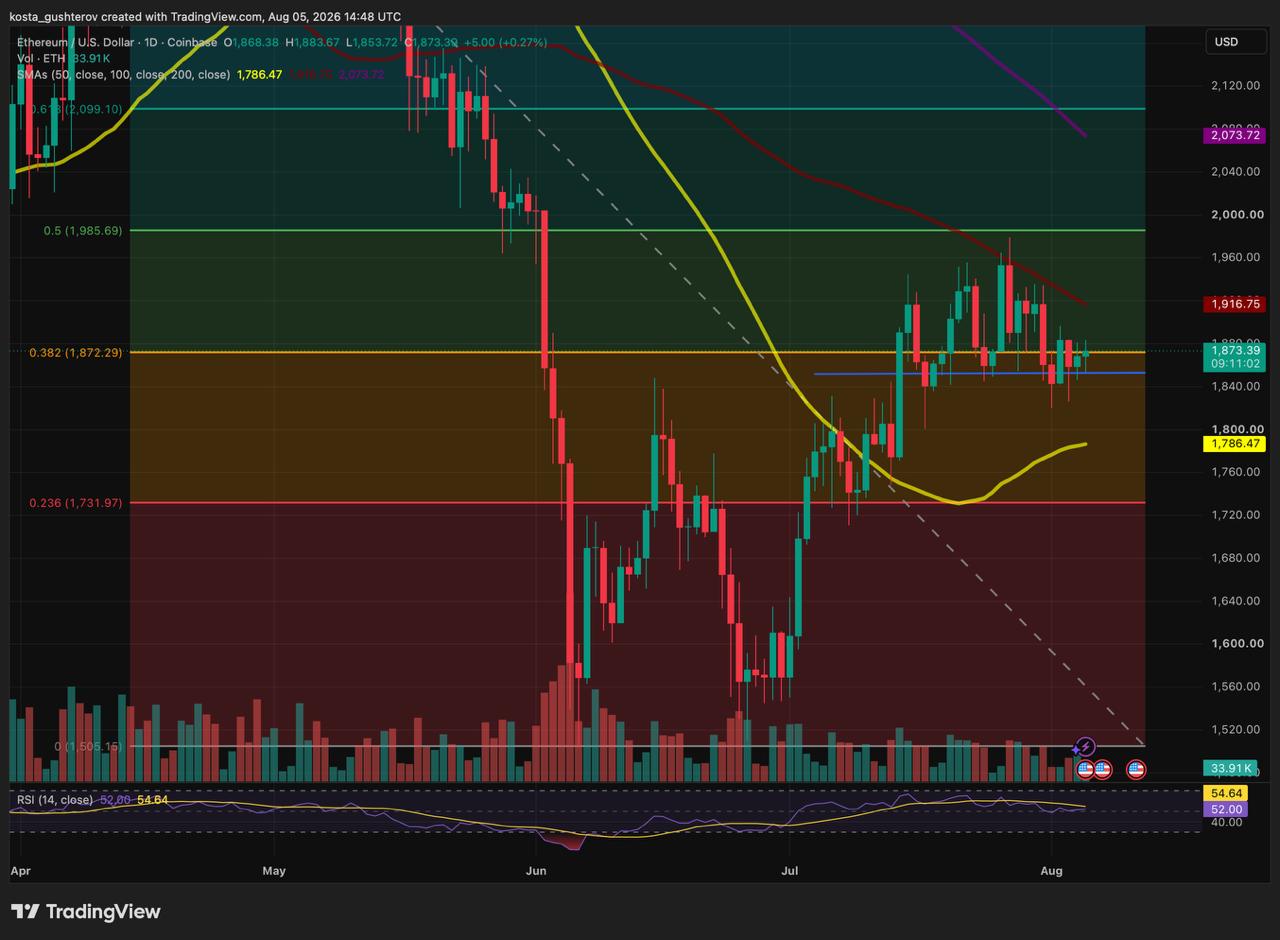
Key TakeawaysEthereum traded near $1,870 on August 5, next to the 0.382 Fibonacci retracement. Horizontal support near $1,850 has contained the latest pullbacks, leaving ETH inside a narrow short-term range.
Ethereum Still Has Not Closed Above $1,872Price has moved above the Fibonacci level during individual sessions, but those attempts have not established support above it. A daily close followed by a successful retest would provide stronger evidence that buyers can defend the breakout.
Ethereum daily price chart – Source: TradingViwUntil then, $1,850 remains the first important support. The level has repeatedly stopped declines during the past two weeks and now forms the lower boundary of the range.
The 100-Day SMA Remains the Key ConfirmationClearing $1,870 would leave another barrier immediately above. Ethereum’s 100-day simple moving average stood near $1,920, less than 3% above the current price.
A simple moving average tracks the average closing price over a specified period. Traders often use the 100-day SMA to assess whether the intermediate trend is improving or weakening.
A close above the average followed by a successful retest would strengthen Ethereum’s short-term structure and bring the 0.5 Fibonacci retracement near $1,990 into focus. That area rejected ETH on July 27 after price approached $1,980.
Funding Is Neutral, but Futures Leverage Remains HighA recent CryptoQuant analysis showed Binance’s ETH funding rate close to zero.
Funding rates are periodic payments exchanged between long and short traders in perpetual futures markets. Positive funding means long positions pay shorts, while negative funding reverses the payment.
A reading near zero shows that neither side is paying a substantial premium to keep positions open. It does not reveal the exact distribution of long and short exposure or whether spot-market buying is supporting the price.
Leverage nevertheless remains elevated. Binance’s ETH Estimated Leverage Ratio stood near 0.65 in the CryptoQuant chart.
The metric compares derivatives open interest with the amount of ETH held in the exchange’s reserves. A higher ratio indicates more futures exposure relative to those reserves, increasing the market’s sensitivity to liquidations when price moves quickly.
Leverage Could Amplify the Range BreakThe elevated ratio points to greater liquidation risk once ETH moves beyond the current range.
A daily close above $1,920 could pressure short positions and add buying as traders close bearish exposure. That would strengthen the possibility of a move toward resistance near $1,990.
A rejection followed by a loss of $1,850 would instead put leveraged long positions under pressure. The next support would sit near the 50-day SMA at $1,790, followed by the 0.236 Fibonacci retracement around $1,730.
Funding provides no strong directional signal, leaving both sides exposed if the range breaks decisively.
Why Ethereum Could Burn More Rewards as Staking Grows
Recent daily candles have narrowed, while trading volume has declined from the levels seen during the June sell-off and the first stage of the rebound.
The daily RSI stood near 52, placing momentum close to the middle of its range rather than showing a strong overbought or oversold condition.
A breakout can still develop on lower volume, but a daily close accompanied by stronger activity would carry more weight than another temporary move above $1,870.
Ethereum Remains Between $1,850 and $1,920A close above the 100-day SMA followed by a successful retest would bring $1,990 back into focus. A loss of $1,850 would instead expose the 50-day SMA near $1,790 and increase the risk of a deeper pullback toward $1,732.
Until one of those boundaries breaks, ETH remains in consolidation. Funding offers no strong directional bias, but elevated leverage could make the next confirmed move sharper than the recent price action.
- Methodology: This analysis is based on the ETH/USD daily chart dated August 5, 2026. Fibonacci retracement levels, moving averages, volume and RSI readings were taken from the chart and rounded where appropriate. Funding-rate and Estimated Leverage Ratio data are based on the cited CryptoQuant analysis and Binance derivatives metrics. Technical levels may vary slightly between exchanges and data providers.
- Disclaimer: This article is provided for informational and educational purposes only and does not constitute financial or investment advice. Technical analysis describes possible market scenarios rather than guaranteed outcomes. Cryptocurrency prices are highly volatile, and readers should verify current market data and conduct their own research before making financial decisions.
Alexander Zdravkov is a market analyst and crypto journalist with interests in economics, broader financial markets and digital assets. His journey into crypto began more than four years ago, driven by a fascination with the rapid evolution of blockchain technology and the transformative potential of decentralized finance. He began analyzing market cycles and identifying emerging trends before they reach the mainstream. He holds a degree in International Relations - a background that helped shape his broader perspective on global economics, geopolitics, and the interconnected nature of modern financial markets. Whether covering the latest developments in the crypto sector or exploring broader macroeconomic themes, Alexander focuses on giving readers context rather than simply repeating headlines. During his career, he has authored more than 5,000 articles covering cryptocurrencies, traditional finance, and global market developments. His work spans everything from Bitcoin and altcoins to macroeconomic trends influencing risk assets worldwide.
read more