


Coinboard - 11/8/2019 9:55:01 PM - GMT (+0 )


Last Updated on
Bitcoin (BTC) Price Prediction – November 8
The Bitcoin bulls are running out of options and it is either they break above $9,218 or risk plunging under $8,500.
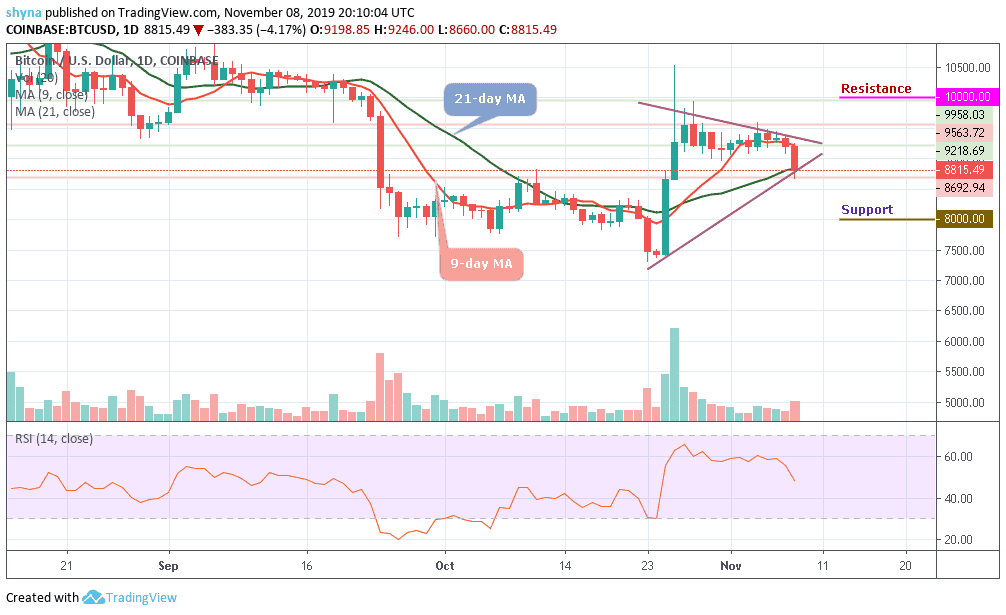
BTC/USD Long-term Trend: Ranging (Daily Chart)Key levels:
Resistance Levels: $10,000, $10,300, $10,500
Support Levels: $8,850, $8, 650, $8,450
Today, after weeks of indecision and ping-ponging between a tightening range, the first-ever crypto-asset finally appears to have made a decision on its direction in the short term and has fallen below the support of $9,000. After some weeks of consolidation, BTC/USD has run out of steam and now begun to fall drastically. The crypto asset is currently trading below the moving averages of 9-day and 21-day and breaking the support level of $9,000.
Meanwhile, the daily chart reveals that the Bitcoin price is declining rapidly and the coin is trading close to the critical support of $8,500, which is down of 4.34% since the beginning of the day. More so, the downside momentum has been gaining traction after the price broke below the 9-day MA on the daily chart. The psychological $8,500 is under threat now and once it is out of the way, the sell-off may be extended towards the support levels of $8,000, $7,500 and $7,000 respectively.
On the daily chart, the bulls will need to see a sustainable move above $9,200 to mitigate the initial bearish pressure. Should in case the coin manages to recover above this handle, then the upside momentum may gain traction and could take BTC/USD to $10,000, $10,500 and $11,000 resistance levels. The technical picture looks bearish as RSI (14) faces level 40 pointing downwards, which indicates that the sell-off may continue.
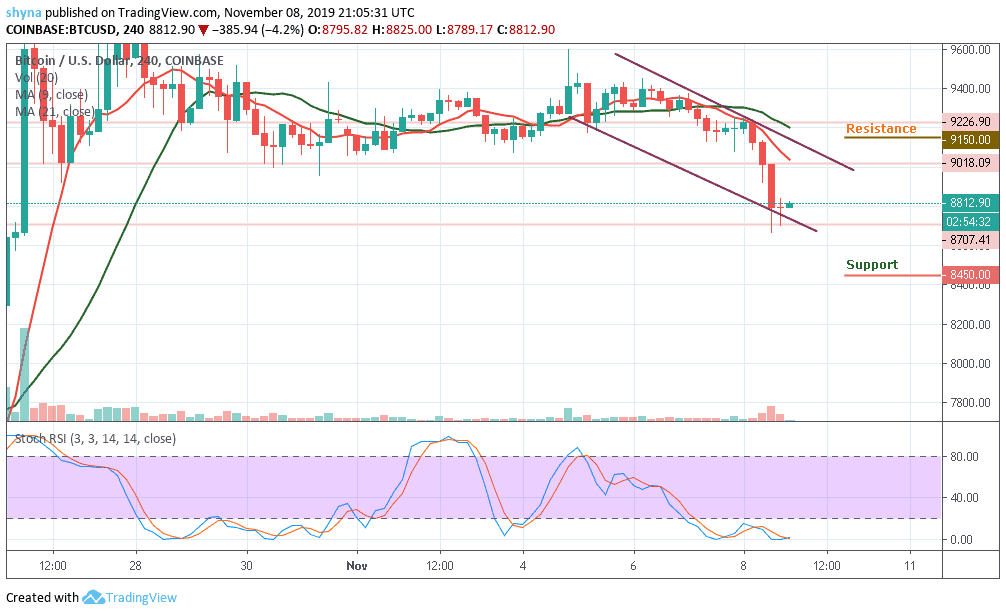
BTC/USD Medium-Term Trend: Bearish (4H Chart)After the crypto faced a long period of consolidation within its previously established trading range, Bitcoin bears have now taken control and pushed the BTC price below its previous support level that existed around $9,000. Although, the Bitcoin price has not yet slipped below $8,500 and it’s still in the loop of making a bounce back. Its price hovers around $8,812.90 and may take time to persistently trade above $9,000.
At the moment, BTC/USD is currently moving below the 9-day and 21-day MAs and the upward movement may likely push the price near the $9,150, $9,250 and $9,350 resistance levels while the immediate support lies at $8,450, $8,350 and $8,250. The stochastic RSI is extremely in the overbought zone.
Please note: Insidebitcoins.com is not a financial advisor. Do your research before investing your funds in any financial asset or presented product or event. We are not responsible for your investing results.
read more