


AMBCrypto - 12/7/2022 10:33:11 PM - GMT (+0 )

Disclaimer: The findings of the following analysis are the sole opinions of the writer and should not be considered investment advice
- At press time, DOT was in a bearish market structure
- DOT could witness a fall to $5.01
Polkadot [DOT] fell below $5.494 after BTC lost support at $17.03K. As BTC struggled to hold above the $17K level, DOT also faced the challenge of holding above the 23.60% Fib level ($5.58).
At press time, DOT was trading at $5.43. Technical indicators point to a downtrend where DOT could find a new support target at $5.01.
Read Polkadot’s [DOT] price prediction 2023-2024
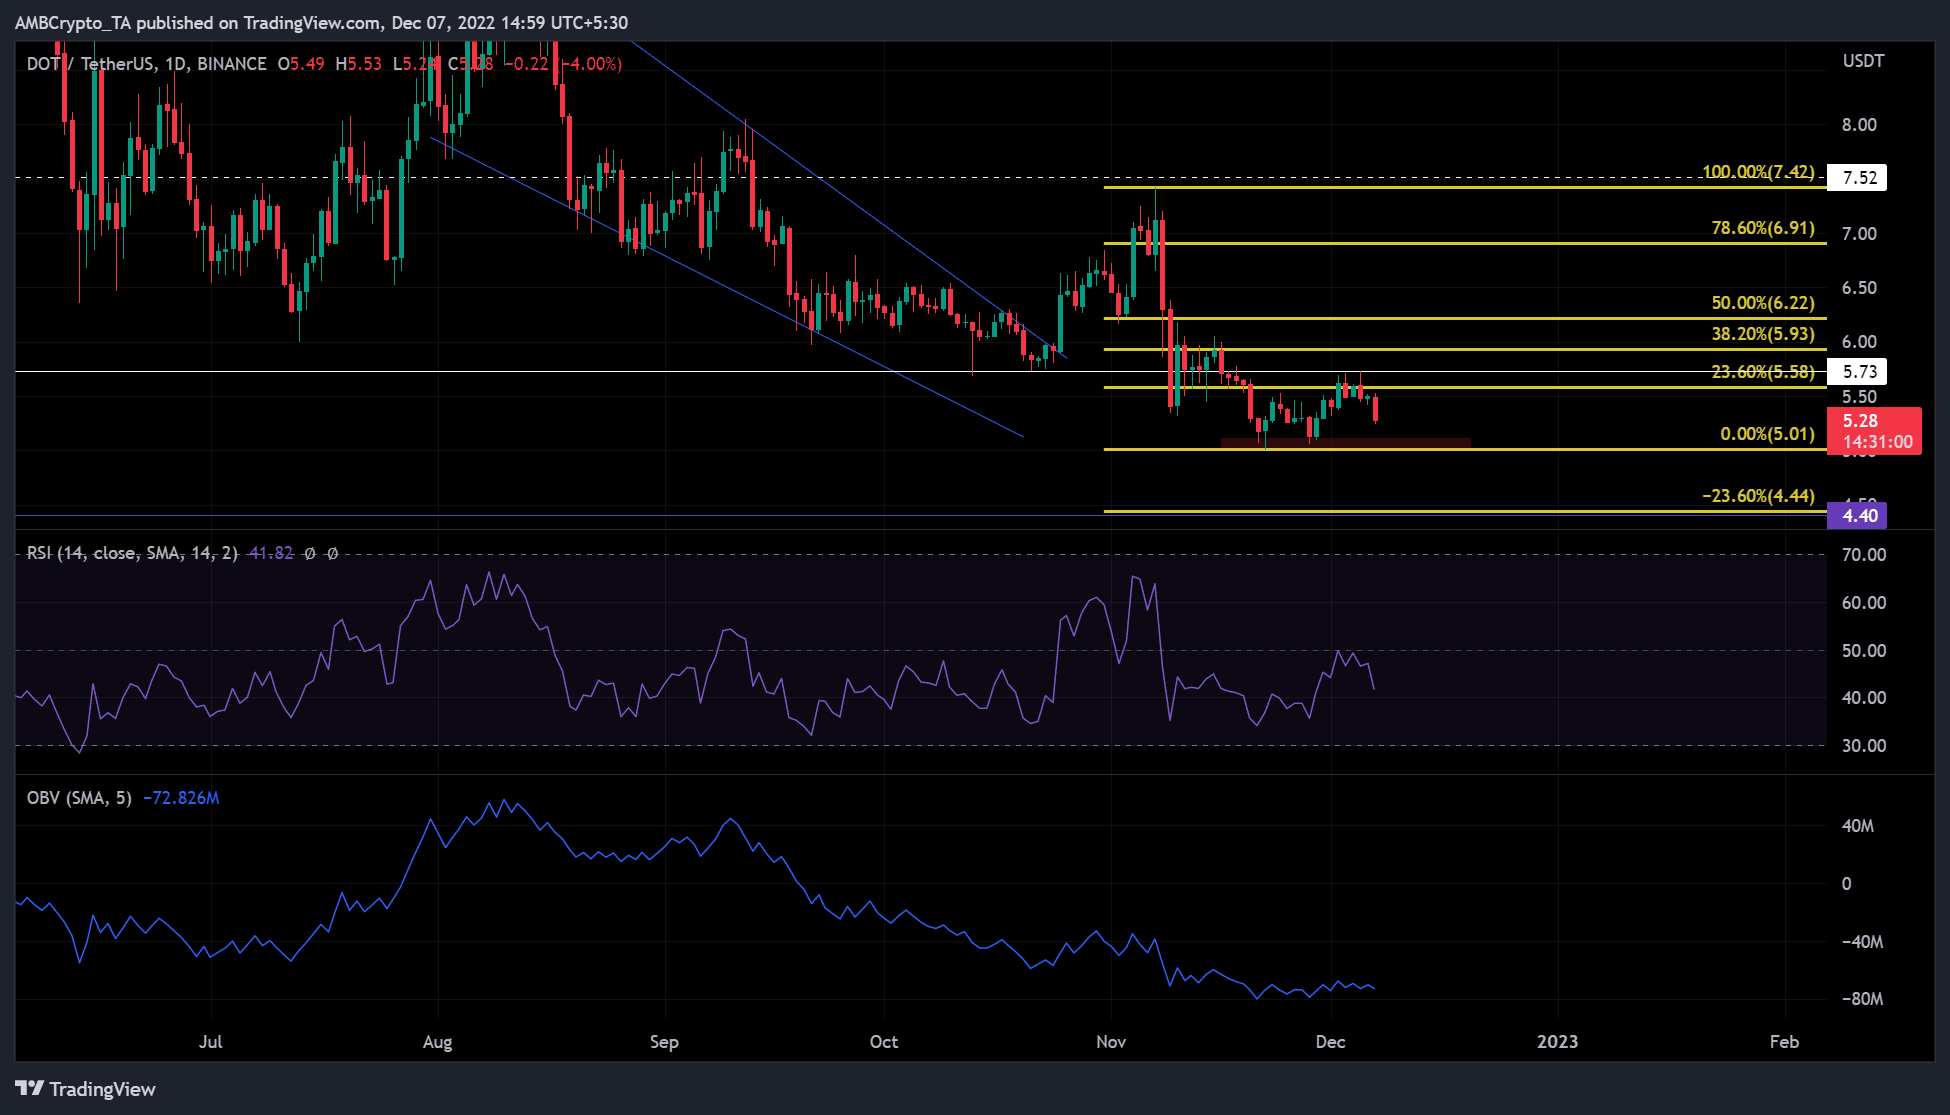
DOT is trading sideways within the 0% and 23.6% Fib levels
After forming a falling wedge pattern between August and October, DOT managed a bullish breakout in early November with a high of $7.42. However, the market slump in early November prevented a further uptrend. This led to a price correction that eroded the gains made in the previous rally.
At press time, DOT faced significant resistance at $5.58. The price tested this level four times without a convincing breakout. This resulted in a sideways market structure that forced DOT into a trading range of $5.01-5.54 in recent days.
Can DOT break out of this range in the next few days? According to the technical indicators, certainly not. At press time, the Relative Strength Index (RSI) retreated from the neutral- 50 level with a steep downtrend. This showed that the market favored the sellers.
In addition, the On Balance Volume (OBV) moved sideways, showing that the trading volume was stagnant. It was, therefore, likely that DOT could trade sideways within the 0% and 23.6% Fib levels in the coming days.
Thus, it was more likely that DOT will drop to $5.01 before trying to retest or break through the current resistance. So traders could benefit by buying on the downside and selling on the upside within the above Fib pocket level. However, an intraday close above the current resistance at $5.58 would negate the above sideways market forecast.
DOT recorded mixed metrics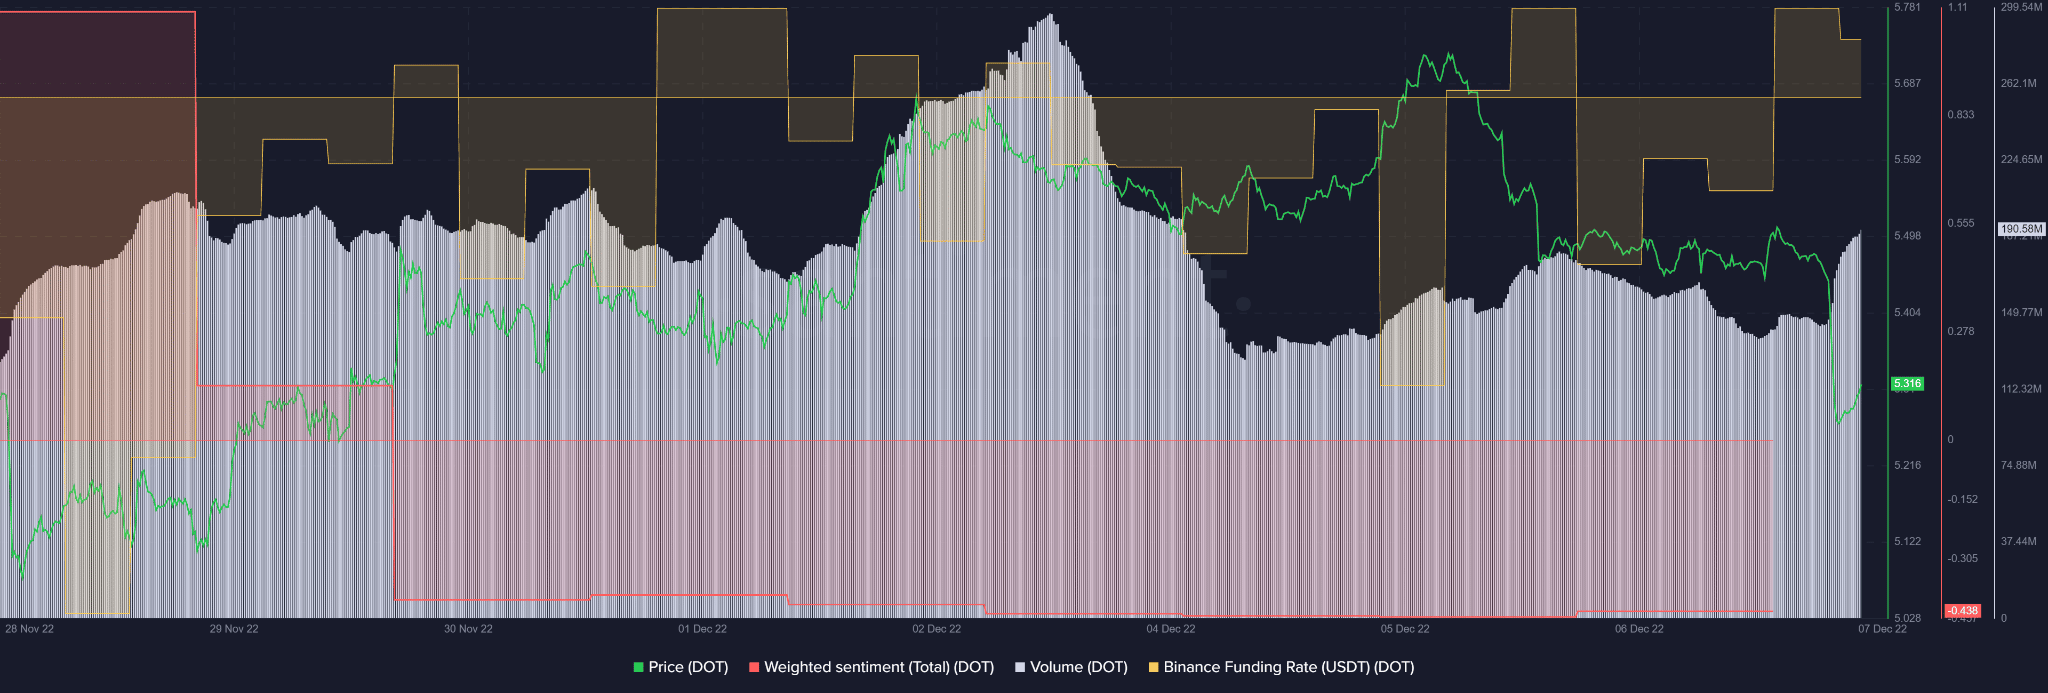
According to Santiment, DOT witnessed a negative sentiment since 30 November. The bearish sentiment was closely related to the DOT’s price performance.
However, Binance Exchange’s funding rates for DOT perpetual contracts were positive at the time of writing. This showed that the outlook of DOT in the derivatives market was positive. It could also mean that the bearish sentiment in the spot market was yet to impact the derivatives market.
This also suggested that DOT could trade sideways while the price followed the above metrics. Thus, DOT could fall to the support zone of $5.01 before moving up again.
However, a bullish BTC will put DOT in an uptrend that could convincingly break the current resistance and invalidate the above prediction.
read more