


AMBCrypto - 12/7/2022 5:18:11 AM - GMT (+0 )

- FTM’s price pullback could retest the former support zone at $0.2395
- The lower timeframes recorded a bearish MACD crossover
- FTM saw a decline in positively weighted sentiment and funding rates
The current price correction in Fantom (FTM) could provide a new buying opportunity for a long trade. FTM’s price action since 28 November has formed a bullish flag pattern.
So, FTM could see a bullish breakout if the current price action follows the flag pattern and settles at the $0.2395 support. This would be a long position that you can maximize only if you buy cheaper after the current price correction.
At press time, FTM was trading at $0.2462, and the bears could pull the price down to retest $0.2395.
Will FTM’s price pullback be the final touch on this flag chart pattern?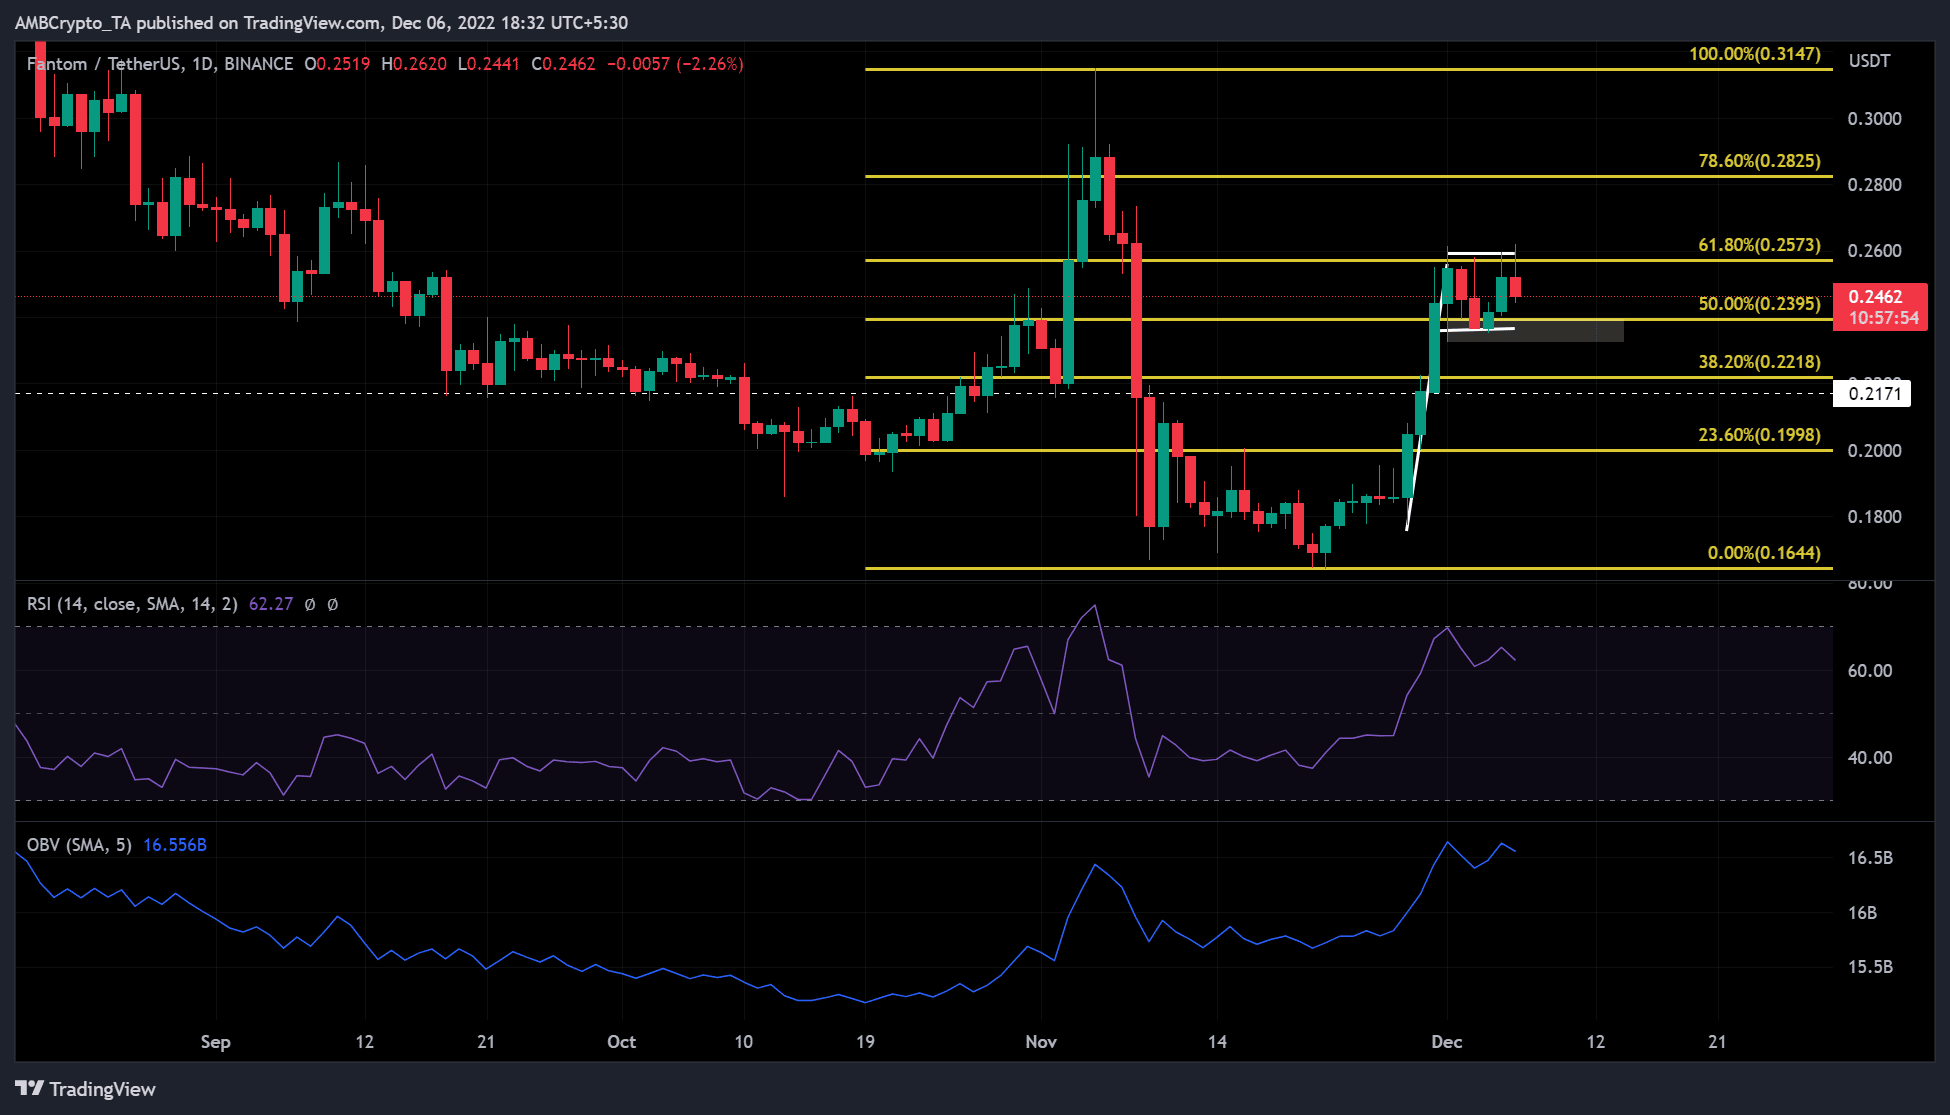
FTM has rallied since 28 November, regaining over 39% of its lost value after the FTX implosion. At the time of publication, FTM’s bears were having a field day, with the lower timeframe charts recording a bearish MACD crossover. It means bears have control of markets in lower time frames and could soon come into more extended time frames.
The bears could prevail until the FTM price reaches the 50% Fibonacci retracement level ($0.2462). The support mentioned above has been reached recently, so the price decline could be a retest of this level.
Furthermore, FTM’s recent price action traces a bullish flag pattern. A price decline to the above level would help complete the pattern in anticipation of a possible bullish breakout.
The Relative Strength Index (RSI) indicator has pulled back from the oversold entry line. This is a sign of easing buying pressure as sellers enter the scene. Consequently, sellers could push FTM down to the $0.2462 level.
In addition, On Balance Volume (OBV) has reached the same highs after a recent surge. This shows that the trading volume is not going beyond the recent level to increase the buying pressure. Thus, the emerging selling pressure could cause FTM to be pushed to $0.2462 or lower.
However, an intraday close above the current resistance at the 61.8% Fib level ($0.2573) would invalidate the above forecast. Such an early bullish breakout would provide a long entry position with the 78.6% Fib level ($0.2825) as a new target.
FTM saw a drop in funding rate and weighted sentiment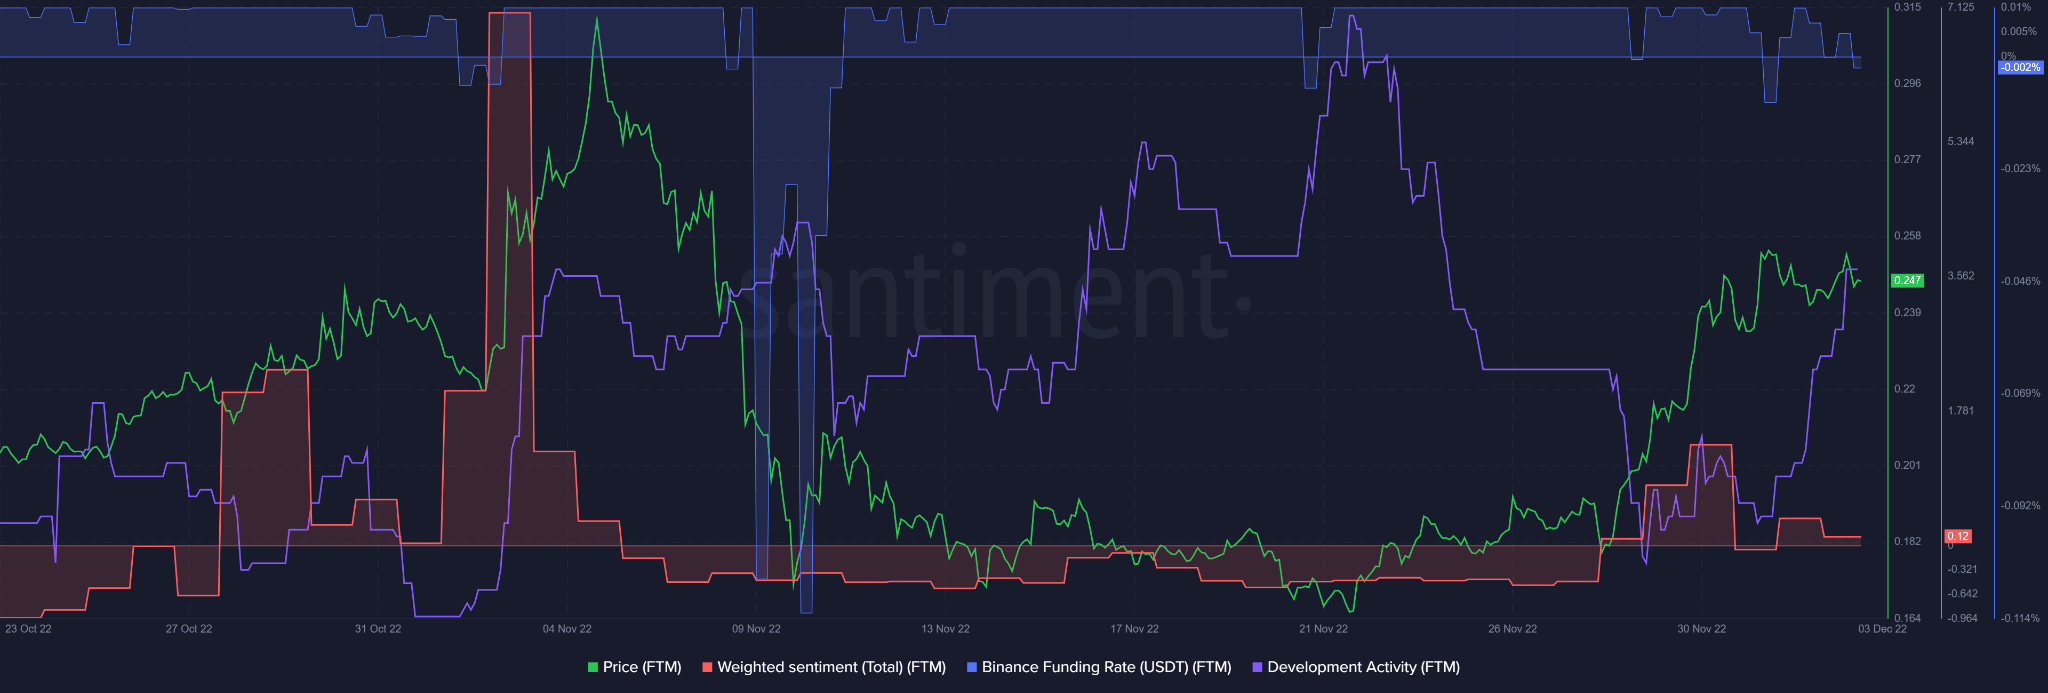
That said, the altcoin saw a slight decline in weighted sentiment and slid slowly toward the neutral position. Accordingly, we observed that FTM’s Binance Exchange Funding Rates slipped into negative territory.
This suggests that FTM’s futures market has a bearish outlook, a similar sentiment that the spot market was slowly adopting, at the time of publication.
In addition, FTM has seen a steep increase in development activity, which leveled off at press time. FTM’s price has risen with the recent surge in development activity. Therefore, a flattening of development activity could undermine further upward trends.
Thus, the above indicators and metrics support the bearish bias that the FTM price will fall to $0.2462.
However, if BTC turns bullish, FTM will front an immediate breakout from the flag pattern, which would invalidate the price’s pullback bias.
read more