


Coingape - 9/27/2021 5:12:05 AM - GMT (+0 )

- Ethereum leads altcoins into recovery after rebounding from last week’s crash to the 100-day SMA.
- Uniswap gains 35% in 24 hours, testing the $25 hurdle after leaving support at $17.5 in the rearview.
The crypto market is making a comeback in the green with a bang as the week takes off. Trading over the week mainly favored the bulls after they defended crucial support levels last Friday. Volatility shot up following news that China has revolutionized crackdown on crypto activity, which the central bank refers to as illegal.
Bitcoin stayed above $40,000, as buyers prevented further losses. As analyzed earlier, Bitcoin has lifted above $44,000 and is looking toward gaining the ground to the supply zone at $48,000.
Ethereum is among the most improved among the top ten crypto assets, posting double-digit gains in 24 hours. However, Uniswap takes the lead position after growing by nearly 35% in the same period. Generally, the market is bullish, giving bulls the best start to the week.
Ethereum:-Ethereum retested support at the 100-day Simple Moving Average (SMA) on Friday following volatile driven market forces from China. Before that, Ether had almost closed the gap to $3,200.
The demand zone in green remains an important region for the bulls and the resumption of the uptrend. With Ethereum trading above $3,100 at writing, all eyes are focused on climbing past $3,200.
Subsequently, a break above the 50-day SMA will validate the uptrend toward the supply zone around $3,600 an in red. The Relative Strength Index (RSI) already adds credence to the bullish narrative, moving from near oversold conditions to the midline.
As this technical index gains traction to the overbought area, bulls gain more aggressive. Note that higher support, preferably above $3,100, will come in handy, allowing bulls an opportunity to work on lifting Ether to $3,600.
ETH/USD Daily Chart
Uniswap bulls have assumed complete control of the price after dropping to $17.5 in the weekend session. After bagging almost 35% in gains in 24 hours, the decentralized finance (DeFi) token trades at $25.
The daily chart shows Uniswap having broken out of a forming falling wedge. This pattern is highly bullish and often marks the beginning of a bull run.
For now, UNI must rise above the 50-day SMA and the 200-day SMA to clear the recovery path to $30. A buy signal from the MACD implies that buyers have the upper hand and will likely keep pushing the token higher in the following sessions.
UNI/USD Daily Chart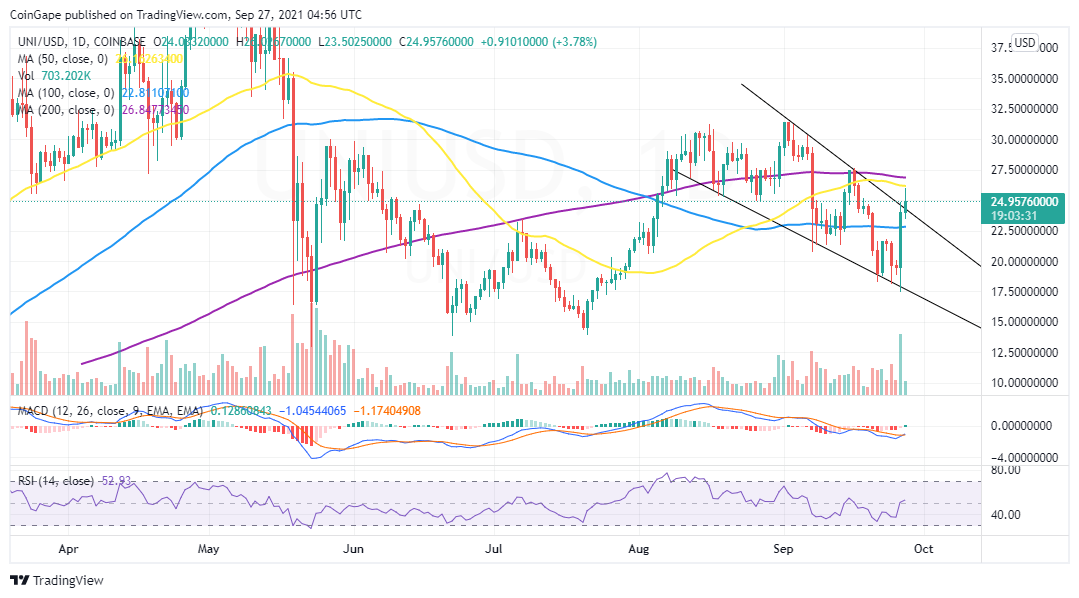
On the downside, establishing higher support is crucial for the uptrend’s continuation. The daily chart shows the 100-day SMA close to 22.5 as the most formidable buyer congestion zone, at least for now.
read more