


AMBCrypto - 10/29/2020 6:04:18 PM - GMT (+0 )


Chainlink for long had been consolidating on the charts but has now finally broken into a bearish trend for the day. The digital asset was likely to be bearish in the short-term period.
Tezos too was registering a strong bearish momentum, with the digital asset recording nearly 6% in losses for the past three days.
Finally, Dogecoin diving significantly below the short-term period moving averages, continued to display a selling sentiment on the trading charts.
Chainlink [LINK]
Source: LINK/USD on TradingView
The digital asset despite being in a short-term uptrend, witnessed some bearishness on its trading charts today. At press time, Chainlink was trading at $11.33 down by a percent since yesterday.
In fact, Chainlink, over the last 48 hours, fell from $12.5 level to the 50% retracement zone or the $11.37 support level, marked by the Fibonacci retracement tool.
Further, the Directional Movement Index with the +DMI (blue) below the -DMI (orange) pointed to the strengthening of a downward price trend.
If sellers were to continue to reaffirm their bearish posture, the price in the coming days may even fall beneath the 50% retracement zone.
Tezos [XTZ]
Source: XTZ/USD on TradingView
Tezos, at press time, was trading at $1.968. XTZ broke out downwards two of its resistance levels at $2.038 and then at $1.996 during the day’s trading session.
Another wave of selling pressure, with the bears gaining strength in the region, in the short-term period was also a likely scenario.
The same was evidenced by early signs of a bearish crossover in MACD. The emergence of the red histogram and the MACD line preparing to dive below the signal line hinted towards a bearish momentum.
Further, the divergence seen in the Bollinger bands may become more prominent, over the next few days. Given the current scenario, a southward price action was more likely.
Dogecoin [DOGE]
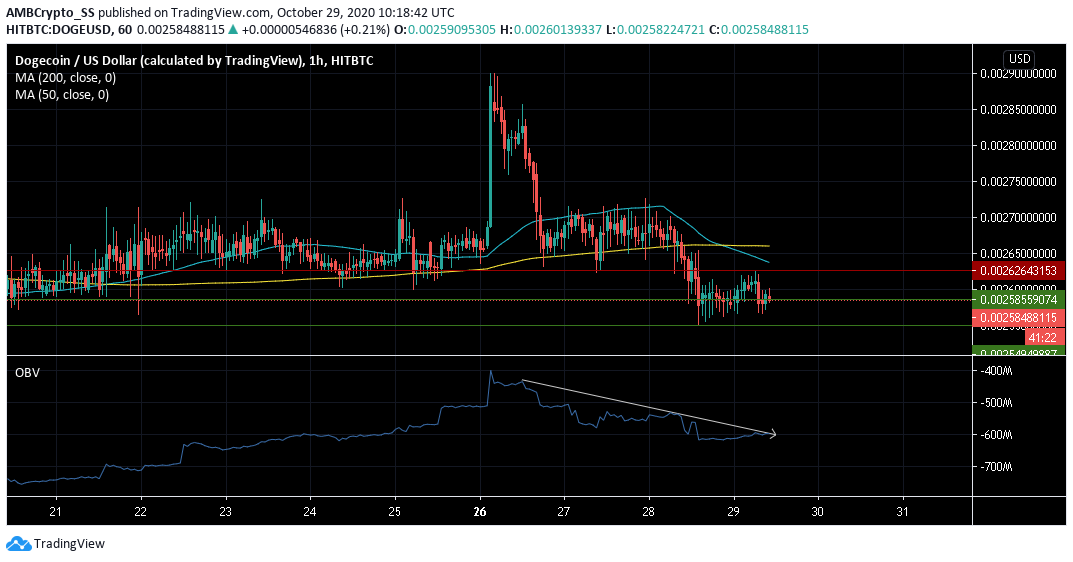
Source: DOGE/USD on TradingView
Dogecoin could be in for another bearish formation, following a price dump below both the 20 and 50 period simple moving averages.
In fact, in a bearish crossover, the 20 SMA (cyan) dived below the 50 SMA (yellow), indicating a strong selling sentiment in the short-term period.
On balance volume also underlined a persistent dip in the level of buying Volumes since 26 October. The low levels of volumes hinted towards the possibility of a price dip towards the $0.00254 support level.
read more