


Coindesk - 3/16/2019 8:19:04 AM - GMT (+0 )

The Litecoin (LTC) price continues to surge following an impressive run over the past month — but is it ripe for a pullback? Let’s take a look.
Fibonacci Retracement
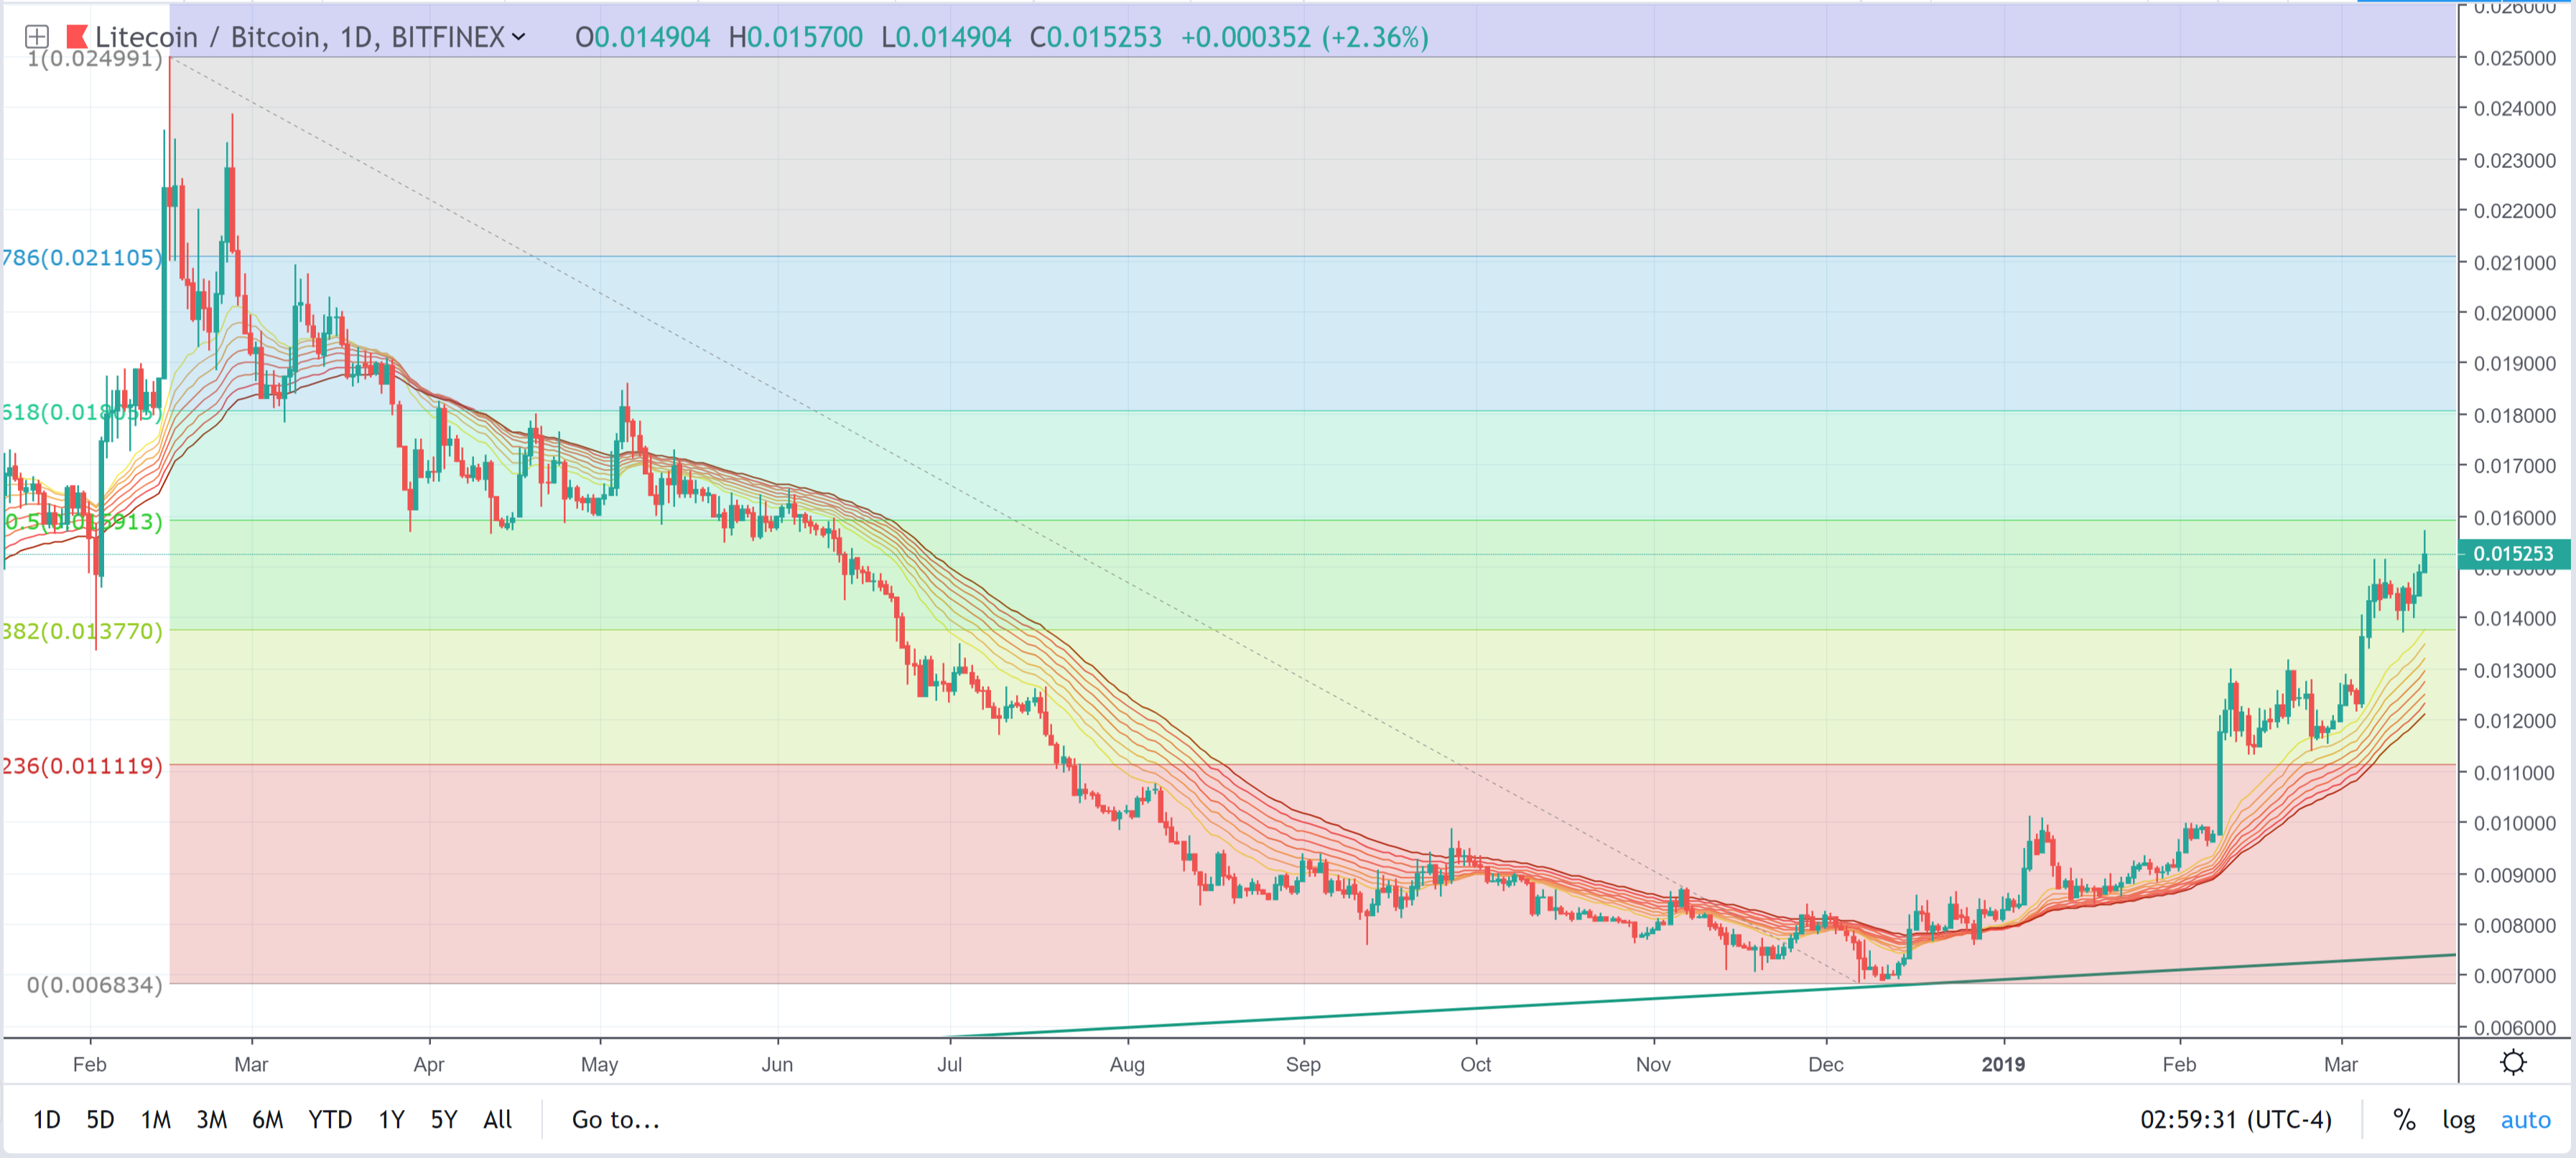
If we take a look at the Fibonacci retracement tool and draw a simple line from the all-time high to its most recent bottom, we can see that the price of Litecoin (LTC) against Bitcoin (BTC) has largely respected each channel while stair-stepping upwards.
After bursting through 0.011 BTC and consolidating the yellow channel, Litecoin subsequently burst through 0.014 BTC. Today, the price of ‘silver to Bitcoin’s gold’ bounced off what will most probably provide some serious resistance — 0.016 BTC. This level acted as previous support from April to mid-June 2018. Knowing that past support frequently becomes resistance, it stands to reason that LTC will have trouble breaking through this level without further consolidation and a healthy pullback.
Relative Strength Indexes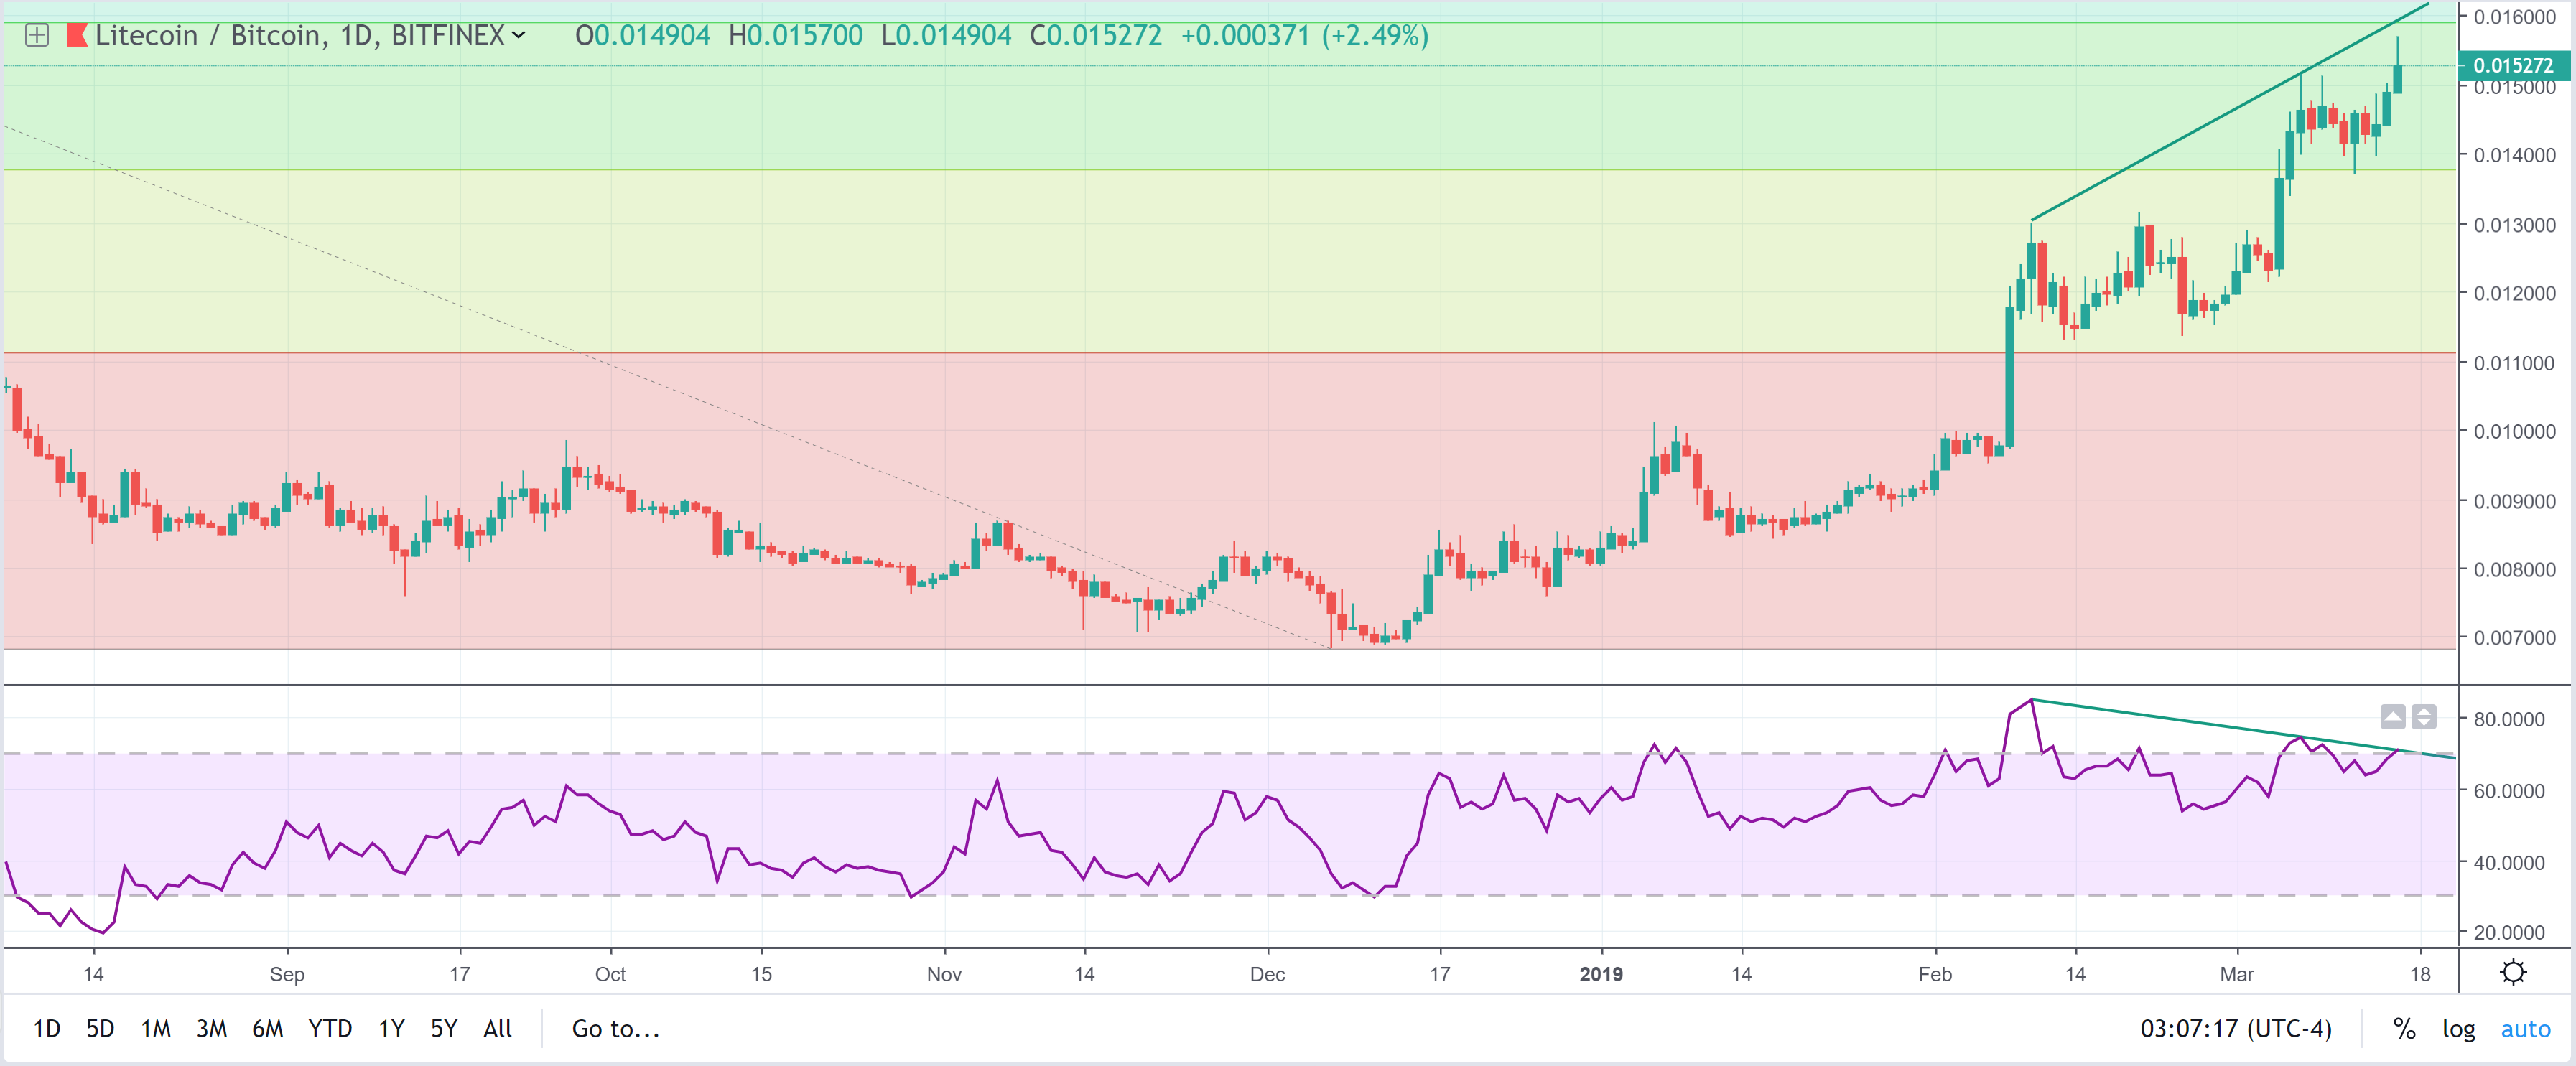
The daily relative strength index (RSI) has once again entered the overbought territory, which signals that the price of Litecoin (LTC) may need to cool off.
More alarming, however, is the severe bearish divergence which continues to rear its ugly head. As you can see in the above chart, the price of Litecoin continues to rise and put in higher highs while the RSI continues to decline. This is generally a bearish signal that the price needs to correct itself and now seems like a ripe time for Litecoin to experience a major profit-taking event as it runs up against a significant level of past support.
Support Levels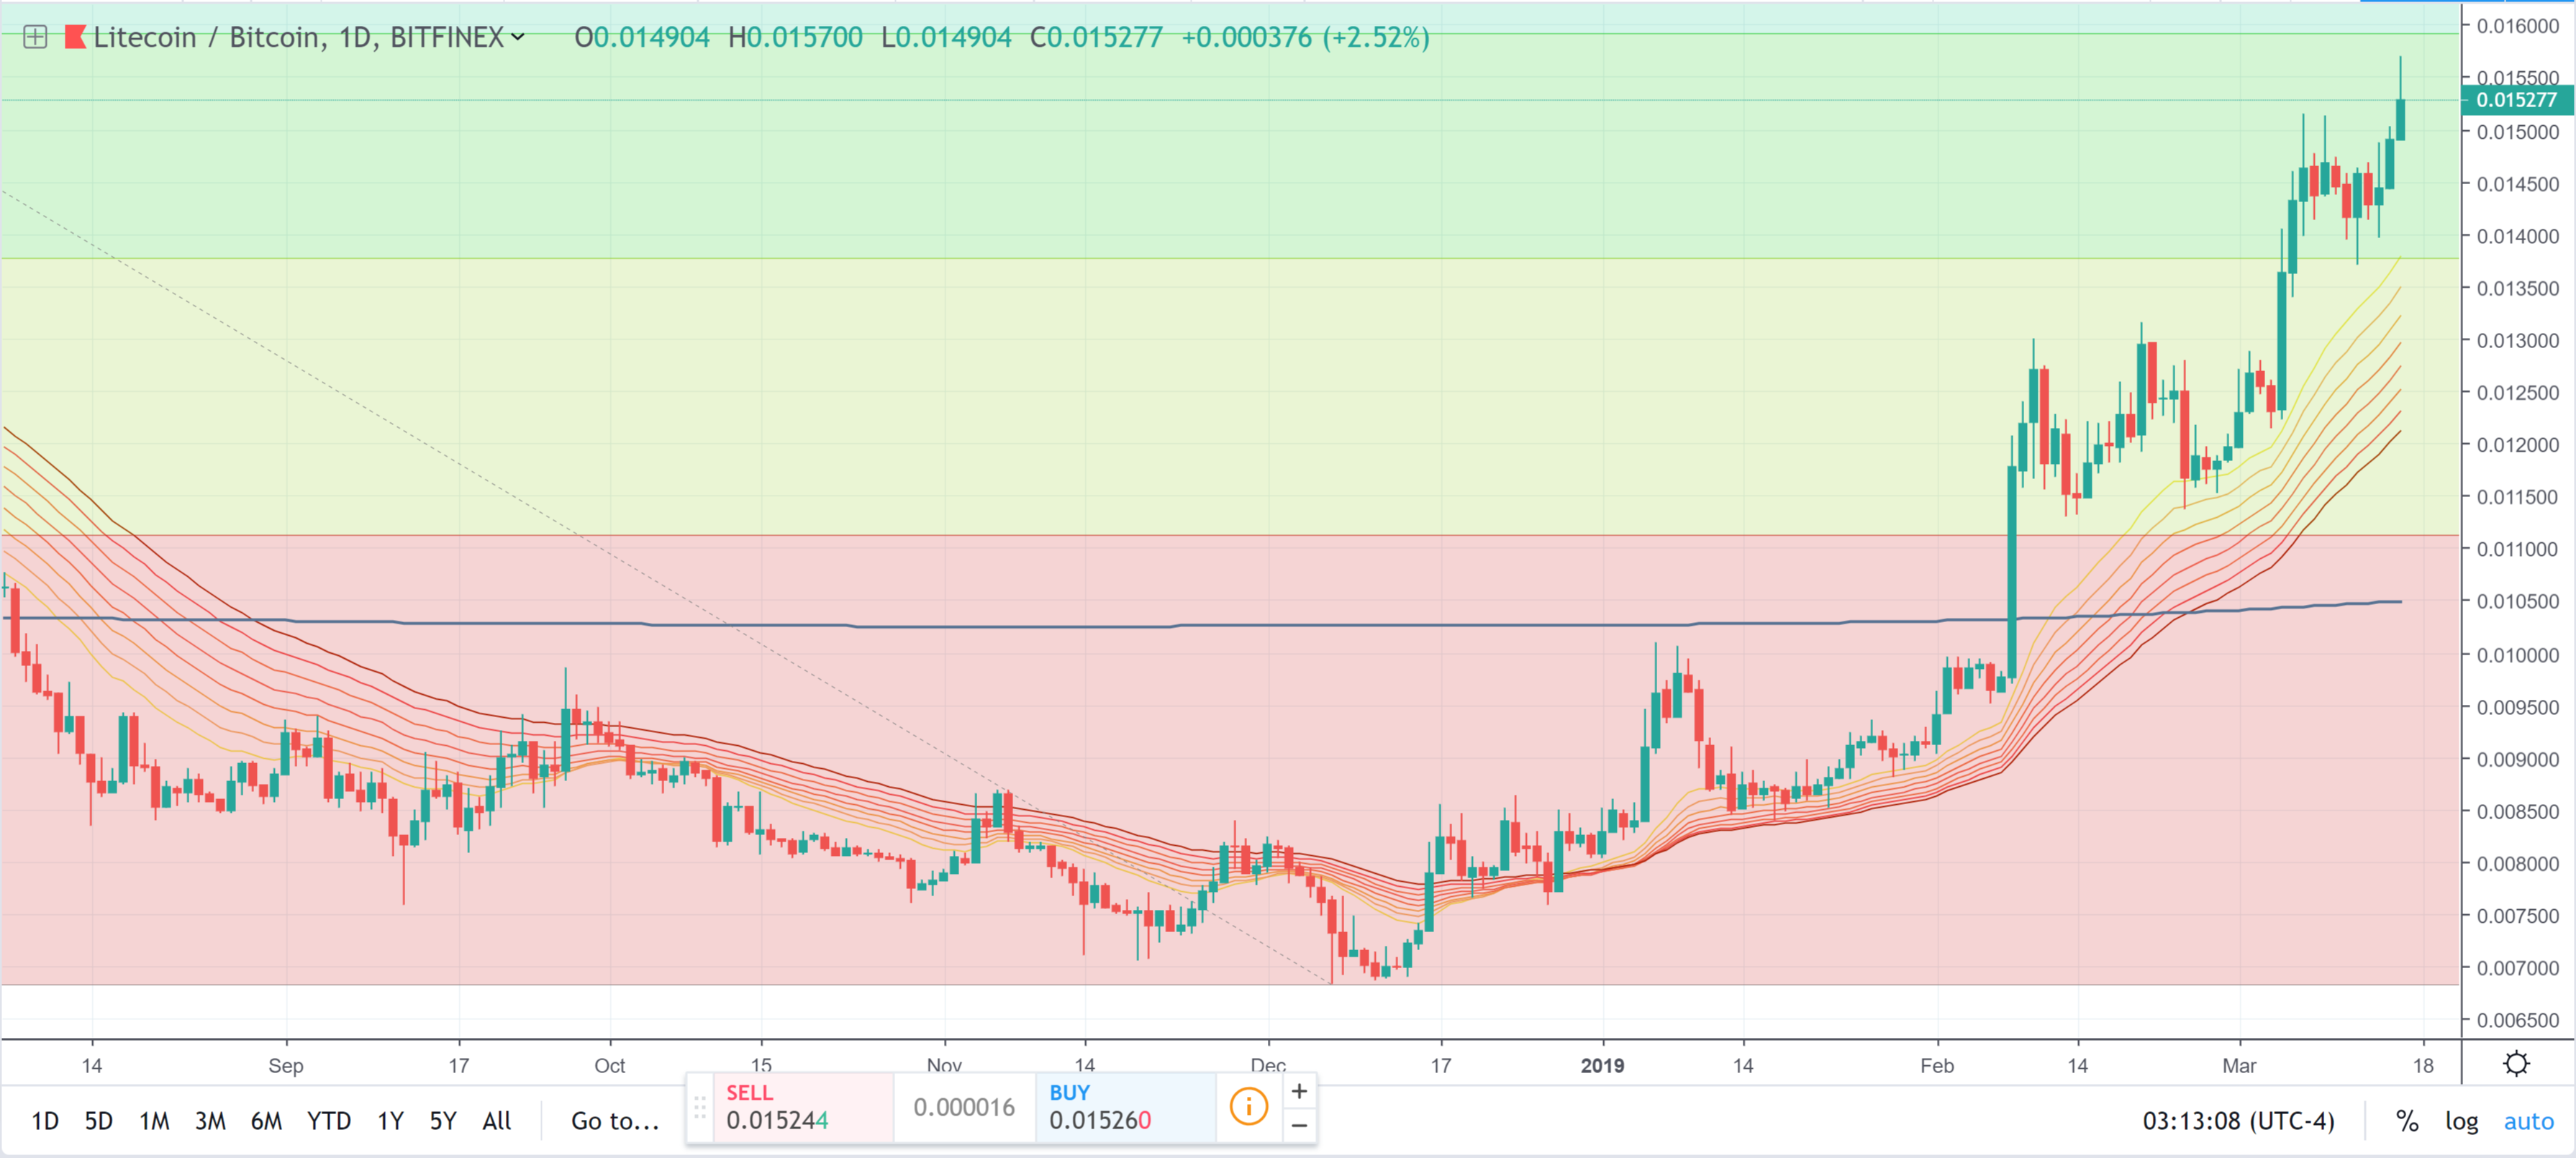
Should Litecoin (LTC) experience a pullback in the near future, there are significant levels of support underneath that should prevent a massive decline.
The exponential moving average (EMA) ribbon, for example, stands to provide the first lines of defense against the bears. These lines would likely match the Fibonacci level between 0.0135 and 0.014 BTC.
In the event of a major profit-taking event and a massive red candle, the 200-week moving average (blue line) would be the last line of defense. A close below that level would be downright catastrophic — but that is currently unlikely and not worth fretting over.
The views and opinions of the writer should not be misconstrued as financial advice. For disclosure, the writer holds Bitcoin at the time of writing.
What do you think of the Litecoin (LTC) price? Let us know your thoughts in the comments below!
Images courtesy of TradingView.
read more