


AMBCrypto - 10/9/2020 3:03:34 PM - GMT (+0 )

Disclaimer: The following article attempts to analyze the impact of emerging patterns on the Ethereum short-term market and its price.
A sudden surge in the market yesterday pushed the price of most major digital assets higher, including Ethereum [ETH]. The boost in the price of ETH carried it from $334 to $353, and after some push and pull, the asset was valued at $350.58.
However, the sudden boost in price made the market very volatile, while also giving way to bulls.
Source: ETH/USD on TradingView
The above chart of Ethereum noted that the asset had been trending downwards, forming lower lows, since 7 October. However, on 8 October, the digital asset traders actively bought the asset as its price reached $334, triggering a bullish buying opportunity. This price action continued till ETH hit $353, after which the buying pressure deflated.
Ever since the asset has marked support at $349 and it has been trading between $353 and $349, forming a descending triangle that can be looked at as a continuation pattern and did not necessarily mean a bearish market. The signal line was under the candlesticks suggesting a bullish price movement. Whereas the Awesome Oscillator was indicating a falling short-term momentum and if the value dipped under zero, the trend could change into a bearish one.
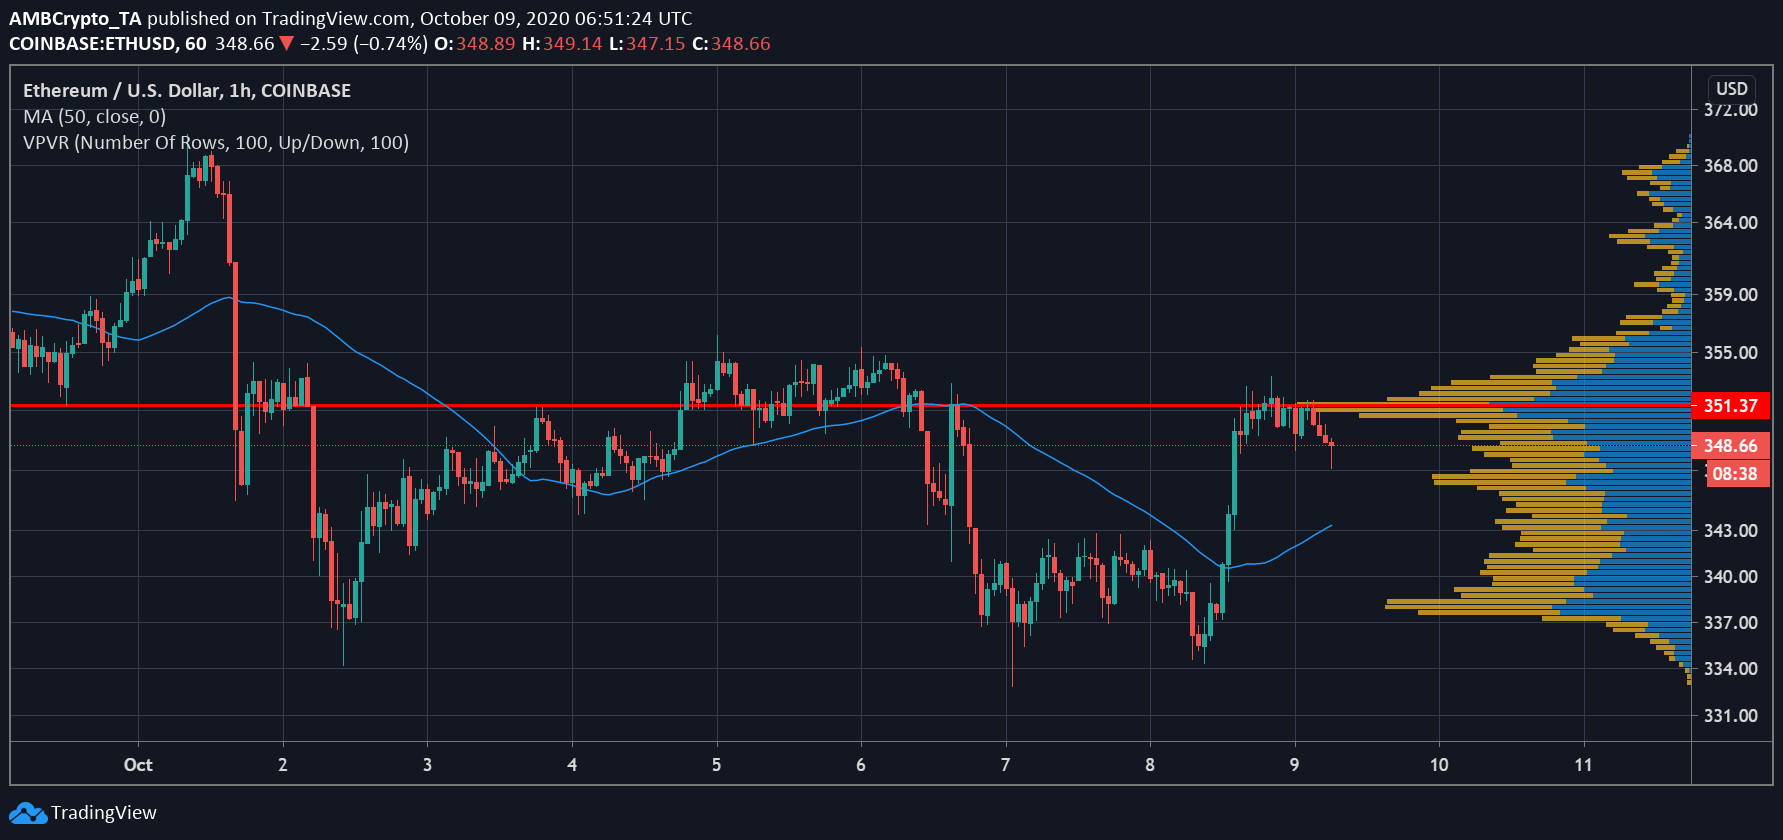
Source: ETH/USD on TradingView
The bullishness of the market was due to the traders’ confidence in the current price range. The visible range noted the value of the asset was currently close t0 the point of controls [POC] at $351, wherein most trade volume is observed in the given period. Even though the value had dipped below this point, the traders were quick to boost it to $350.
The 50 Moving average was also cruising under the price bars, since the boost. this indicated the price movement going strong upwards. According to the visible range, if the value of ETH falters, the support could be seen at $346, followed by $337-$338.
read more