


AMBCrypto - 6/16/2020 9:31:22 AM - GMT (+0 )
Disclaimer: This article attempts to analyze Ethereum’s price movement leading up to a potential breakout in the first week of July.
Ethereum has been one of the best performing cryptocurrencies this year. After facing a couple of bearish days, Ethereum has once again started consolidating above the $230-mark. After surging by 3.19% over the last 24-hours, the world’s second-largest crypto-asset was valued at $231.20, at the time of writing.
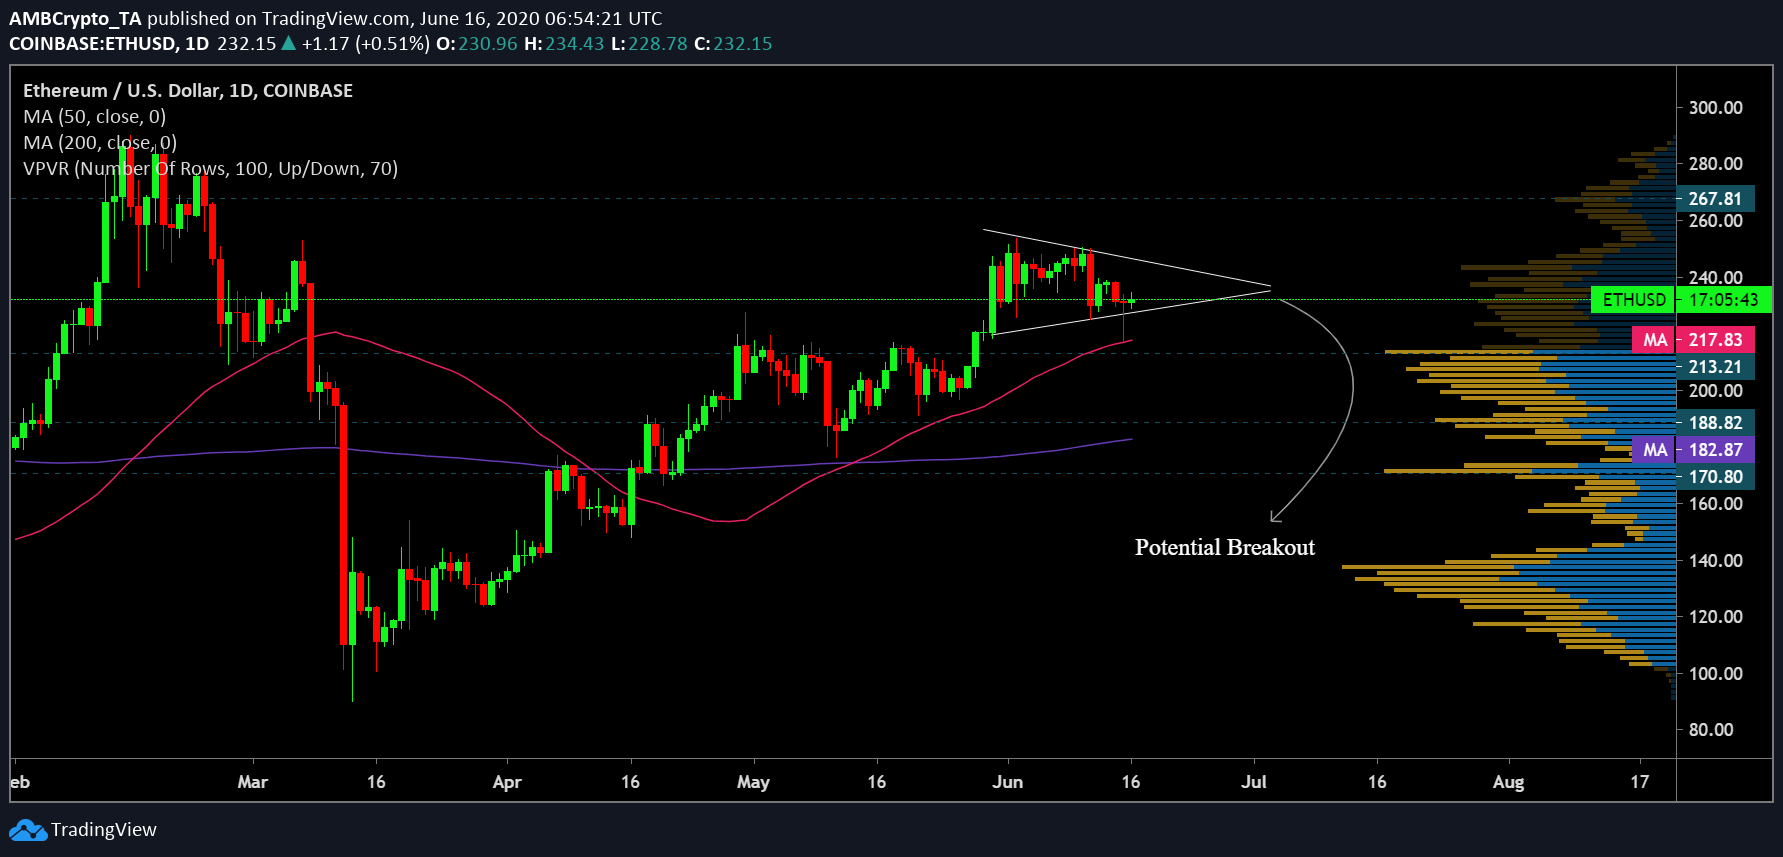
Ethereum [ETH] Daily chart
Source: ETH/USD on TradingView
Ethereum has maintained a consistent uptrend, despite many pullbacks. On the daily chart, the ETH price candles appeared to be oscillating between the two trendlines of a symmetrical triangle, a breakout from which was predicted to take shape in the first week of July and can be in either direction. The daily moving averages aligned with a bullish break in the long-term for Ethereum.
The 50 DMA [Pink] underwent a golden cross with the 100 DMA [Purple] in the second week of May. The gauge has been on the rise ever since, picturing a positive trend for the coin. Additionally, both the moving averages were below the price candles and firmly supported against any further decline.
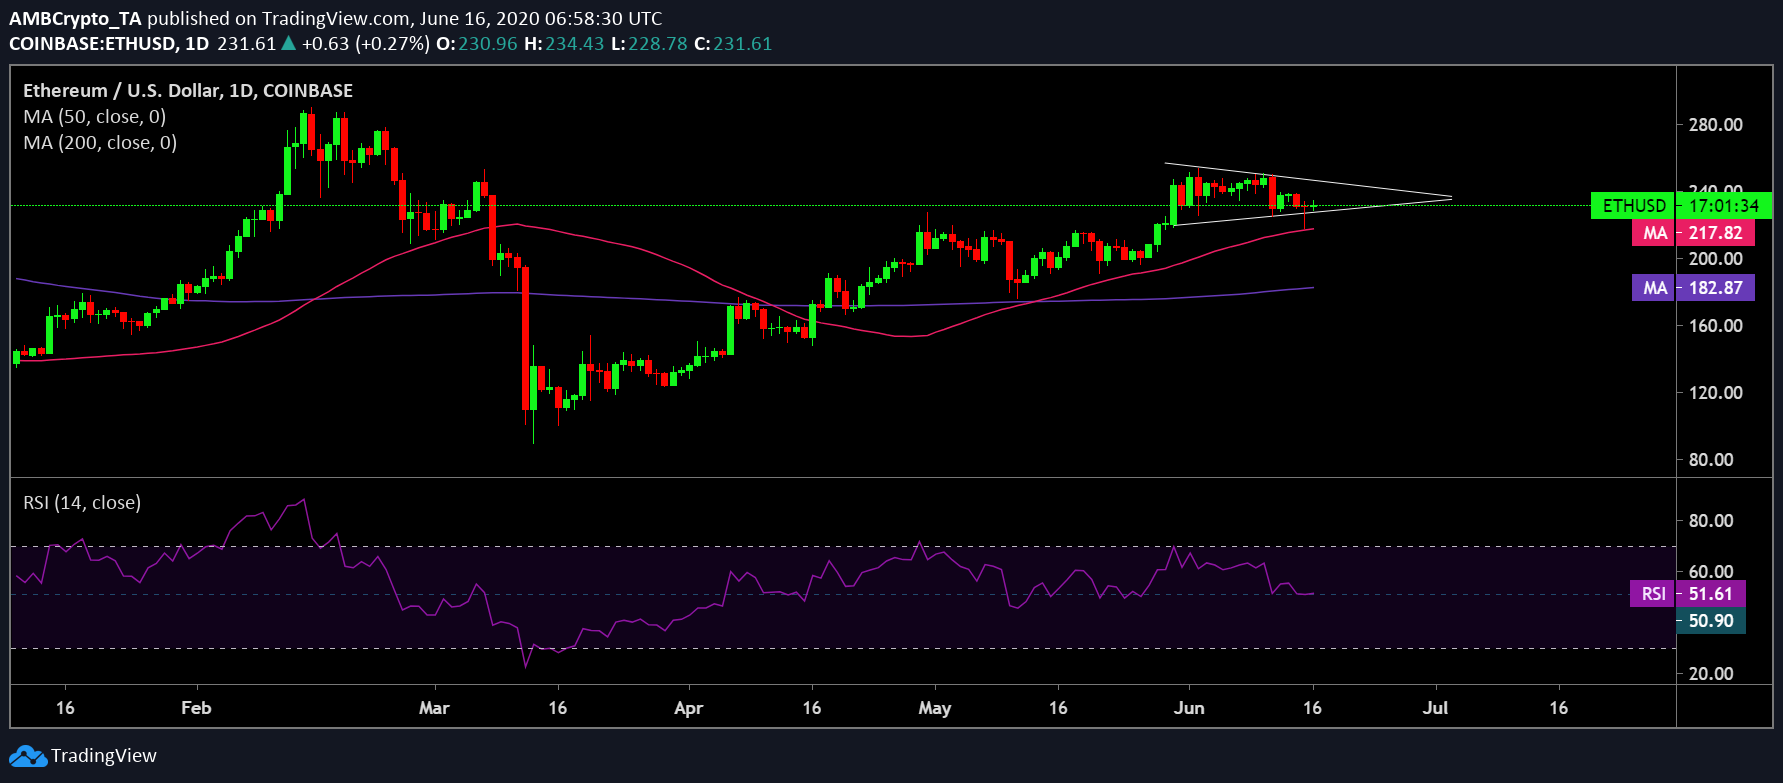
Source: ETH/USD on TradingView
The RSI indicator has also so far managed to dodge dipping below the 50-median line. This suggested a sentiment of steady buying pressure among investors in the ETH market.
The attached charts suggested that the price of Ethereum is potentially primed for further gains as a breakout in the first week of July could materialize on the upside. In this case, the coin could climb all the way to $267.80. If the bullish trend gains further momentum, ETH could also target another resistance point at $286.7, a level not seen since the second week of February. The coin’s price was supported by the two DMAs to prevent further dips. It also found crucial support at levels of $213.2, $188.82, and $170.8, respectively.
Your feedback is important to us!
read more