


Coingape - 11/29/2019 9:08:19 AM - GMT (+0 )


It seems the worst is over for Bitcoin (BTC) in 2019 as indicators show signals of a possible bullish trend at the close of the decade. An inverted head and shoulders pattern is forming on the 4H timeframe charts with the price bouncing off the neckline for the past few candles. A completion of the pattern – breaking above resistance at $7,900 USD – may signal a possible run back up above $10, 000.
Bullish Patterns Forming on BTC/USDThe price of BTC is back up above $7,500 following a shock drop to sub-$7,000 levels in the past fortnight as the market flooded with negative news. The short spike to $7,542 USD saw the price break above the head and shoulders pattern neckline at $7,520 on November 28th as bulls struggle to take charge of the market.
Scott Melker, a crypto trader at Tx West Capital, tweeted on the price retest at the neckline, seeing huge volumes transacted during the period.
I don’t usually post phone charts but… that retest of resistance as support and the neckline of the inverse head and shoulders was astounding. Caught more orders there. $BTC pic.twitter.com/2UsyhhraiH
— The Wolf Of All Streets (@scottmelker) November 28, 2019
The spike in volume is a strong bullish signal and may see the price soar above the $10K mark in the coming weeks if bulls push the price above $7,902 resistance level.
The relative strength index oscillates around the middle band rising towards overbought levels. If the RSI moves towards the overbought levels, bulls may fall into a trap as they get exhausted and volumes reduce.
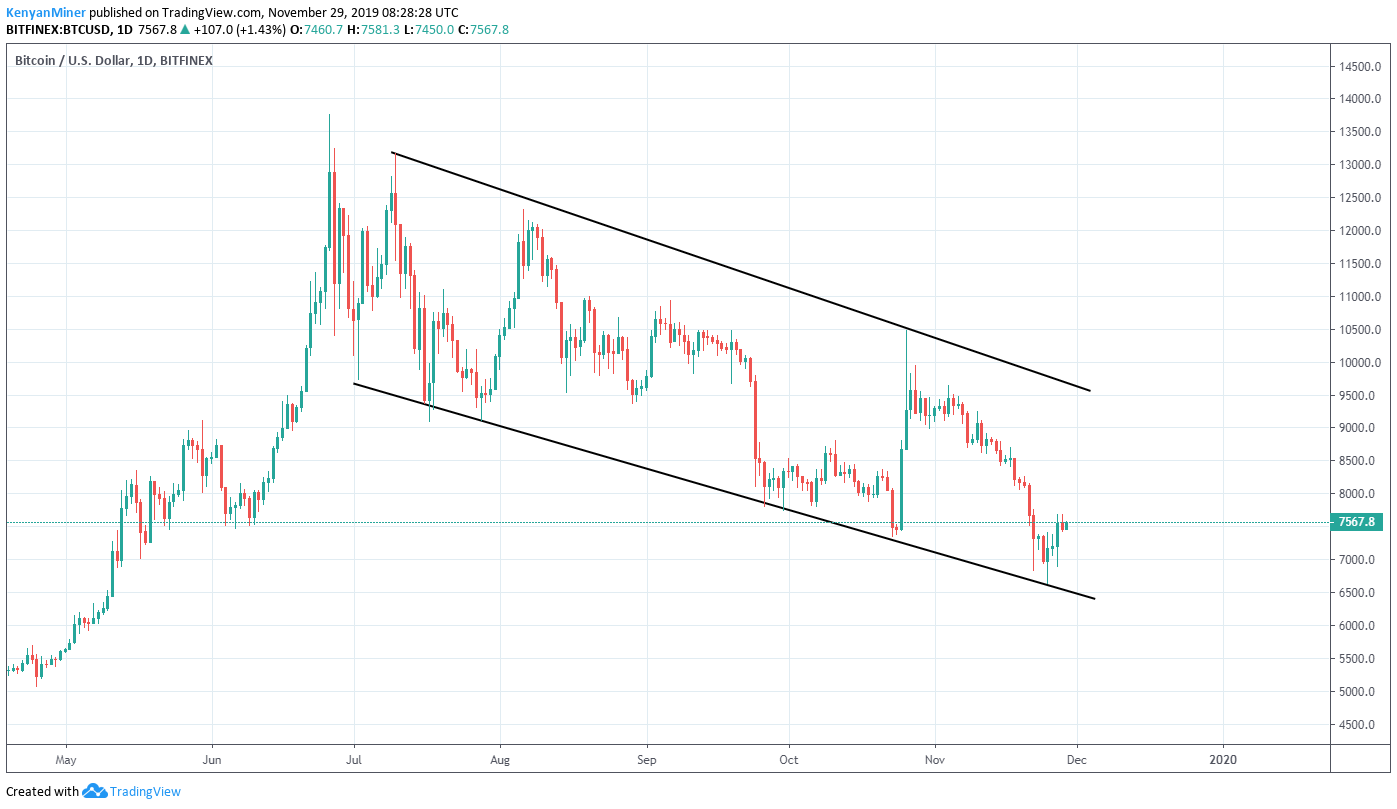
A Possible Drop to $7,000?While the inverse head and shoulders pattern signals an upcoming uptrend, failure to complete the pattern – failure to break resistance at $7,900 level – may trigger bears into taking over the market. Zooming out to daily charts, the price of BTC remains deeply entrenched in the bearish channel starting in June, despite testing resistance a couple of times.
According to Coingape analyst, the price of BTC is set to drop below the $7,000 level as bulls struggle to push up the price towards the resistance level of the bearish channel.
Images from TradingView
Disclaimer The views, opinions, positions or strategies expressed by the authors and those providing comments are theirs alone, and do not necessarily reflect the views, opinions, positions or strategies of CoinGape. Do your market research before investing in cryptocurrencies. The author or publication does not hold any responsibility for your personal financial loss.
Been in the field since 2015 and he still love everything blockchain and crypto! FC Barcelona fan. Author and journalist. Follow him at @lujanodera.
read more