


Bitcoinist - 8/14/2019 7:09:17 PM - GMT (+0 )


Over the last 48 hours, Bitcoin price has broken support at $11,000 mentioned in my previous analysis and has since dropped back to support around $10,100. High selling volume indicates further downside over the coming days.
Bitcoin 2-Hour Price Analysis
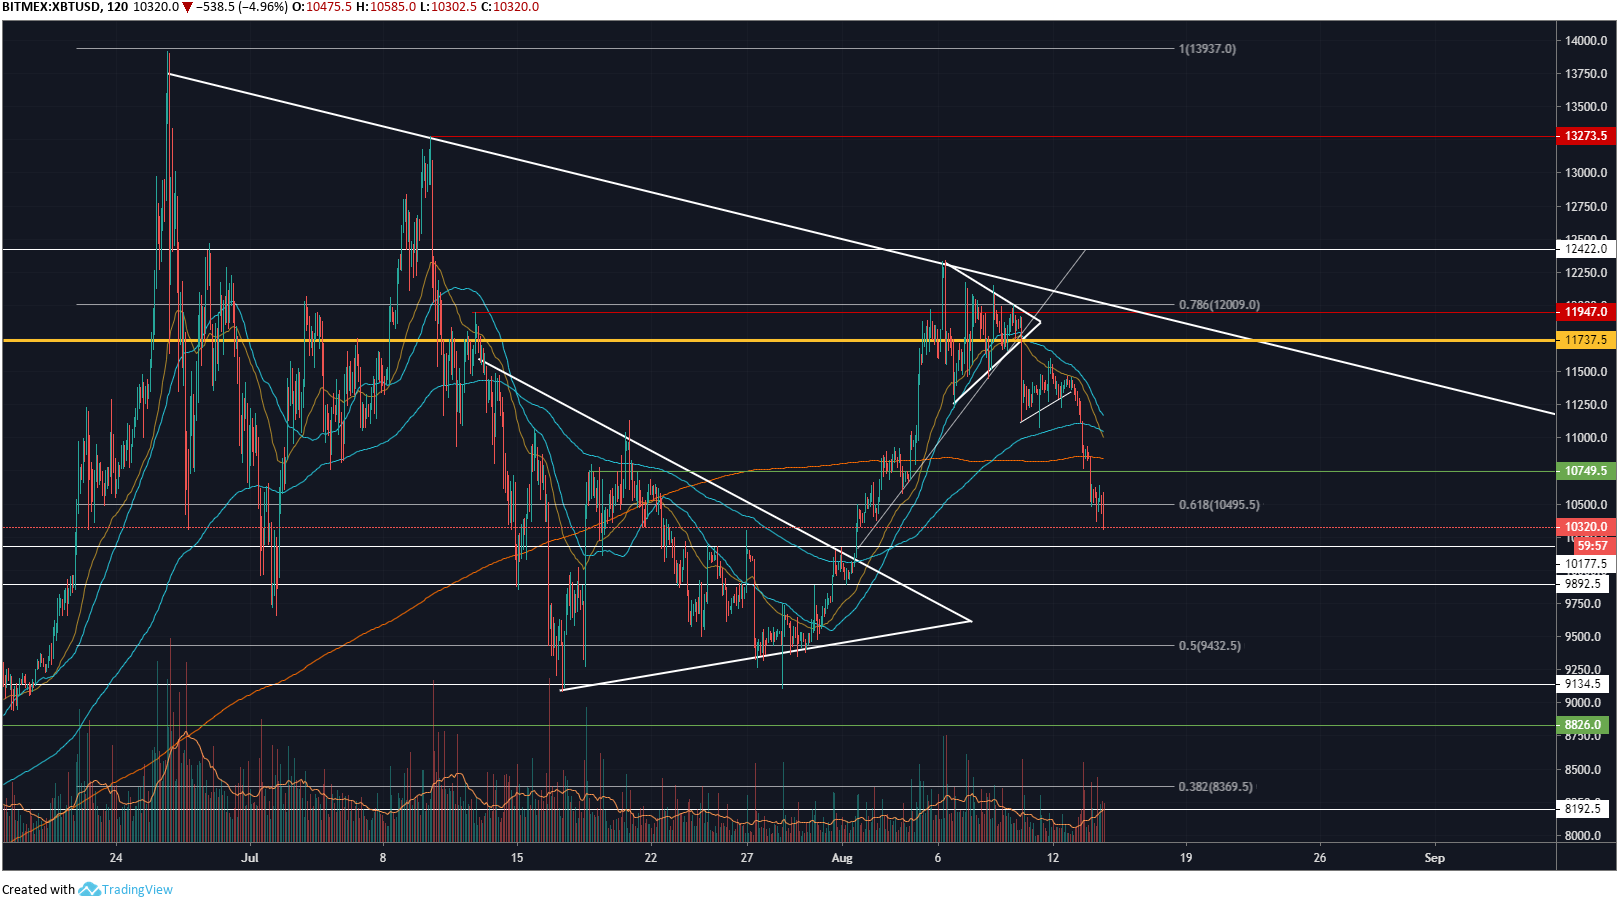
On the 2 hour chart for XBT/USD, we can see support above $11,000 has been broken convincingly with a clear increase in selling momentum. Bears are in control of the short-term price action as price levels approach key support between $10,170, and $9,890. 50 MA and 200 EMA have yet to cross down over each other meaning a bounce could happen beforehand resulting in a continuation of the bullish short-term trend.
Overhead resistance around $11,100 stemming from the yearly high around $14,000 is the main resistance point to look out for if price levels do proceed to bounce. If this resistance point is broken price levels will likely re-test the yearly high.
There’s a chance BTC will make a new lower low over the coming days and weeks to put fear into long traders before the real breakout of the overhead resistance mentioned. It’s likely $8,100 will be the lower low region. 0.5 Fibonacci level at $9,400 is also a key support area to look out for however, it’s much more likely that Bitcoin price will create a lower low.
Bitcoin 30-Minute Price Analysis
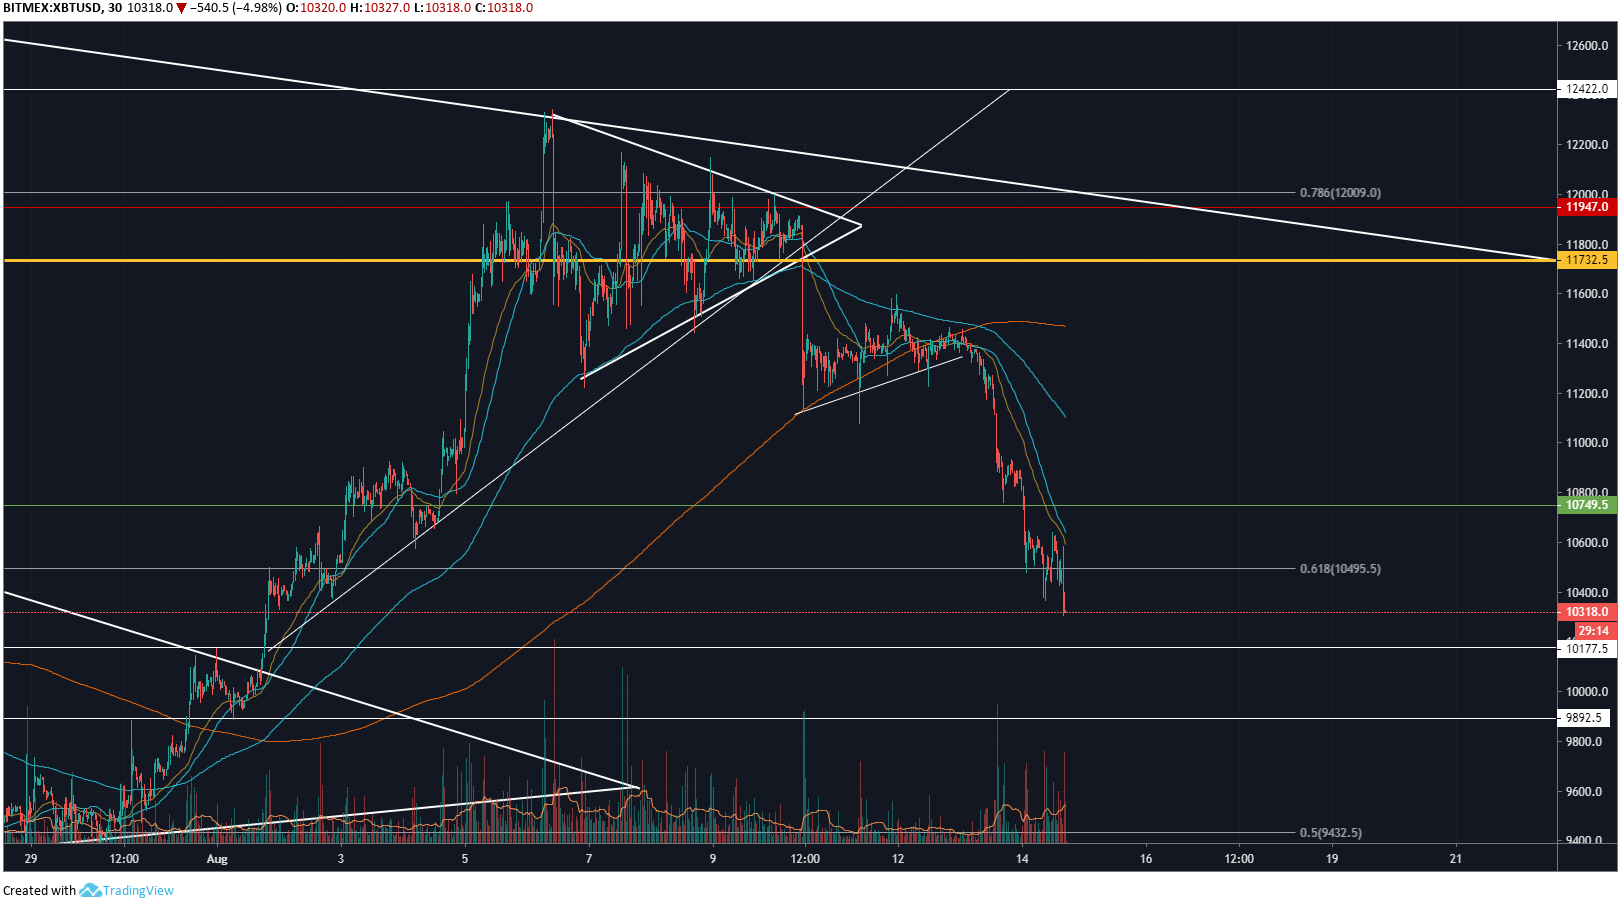
On the 30 minute chart for XBT/USD, we can see the small rising support level around $11,100 that has recently broken. This break-down was met with clear selling pressure indicating bulls are no longer in control of the short-term trend.
POC has yet to move down and still sits at the previous asymmetrical triangle break-down point at $11,700. If this POC doesn’t move down over the coming days it’s increasingly likely that a bounce will occur.
The medium-term bitcoin price trend is still very much bullish, it’s important to not let short-term bearish price action to cloud judgment. As long as $8,100 region holds the current market price action is merely required volatility in order to sustain such bullish momentum that took price levels to $14,000 from the depths of $3,000.
Selling momentum will need to come to a halt with a clear influx of bullish volume for a bounce to occur. Key support levels to look out for during a continuation of the short-term pullback is $10,100, $9,800, $9,450, $8,800 and $8,100. If the last support level is broken the trend is no longer bullish and will be hard to gauge re-entry points.
Do you think Bitcoin price will create a lower low over the coming days? Please leave your thoughts in the comments below!
This article is strictly for educational purposes and should not be construed as financial advice. Images via Bitcoinist Image Library, BTC/USD charts by TradingView
The post Bitcoin Price Analysis: BTC Breaks $11,000 Support appeared first on Bitcoinist.com.
read more