


Bitcoinist - 4/16/2019 12:18:22 PM - GMT (+0 )


The Mayer Multiple (MM) by Trace Mayer is showing that bitcoin price has already bottomed out signaling the end of the 15-month long bear market.
History Repeating Itself for Bitcoin?
In the chart above, the green circles represent the MM indicator moving above 1.0 signaling the establishment of a long-term bottom for bitcoin price 00.
Going by this information, it appears another indicator is showing that BTC may have already bottomed out, marking the end of a bear market, which started in December 2017.
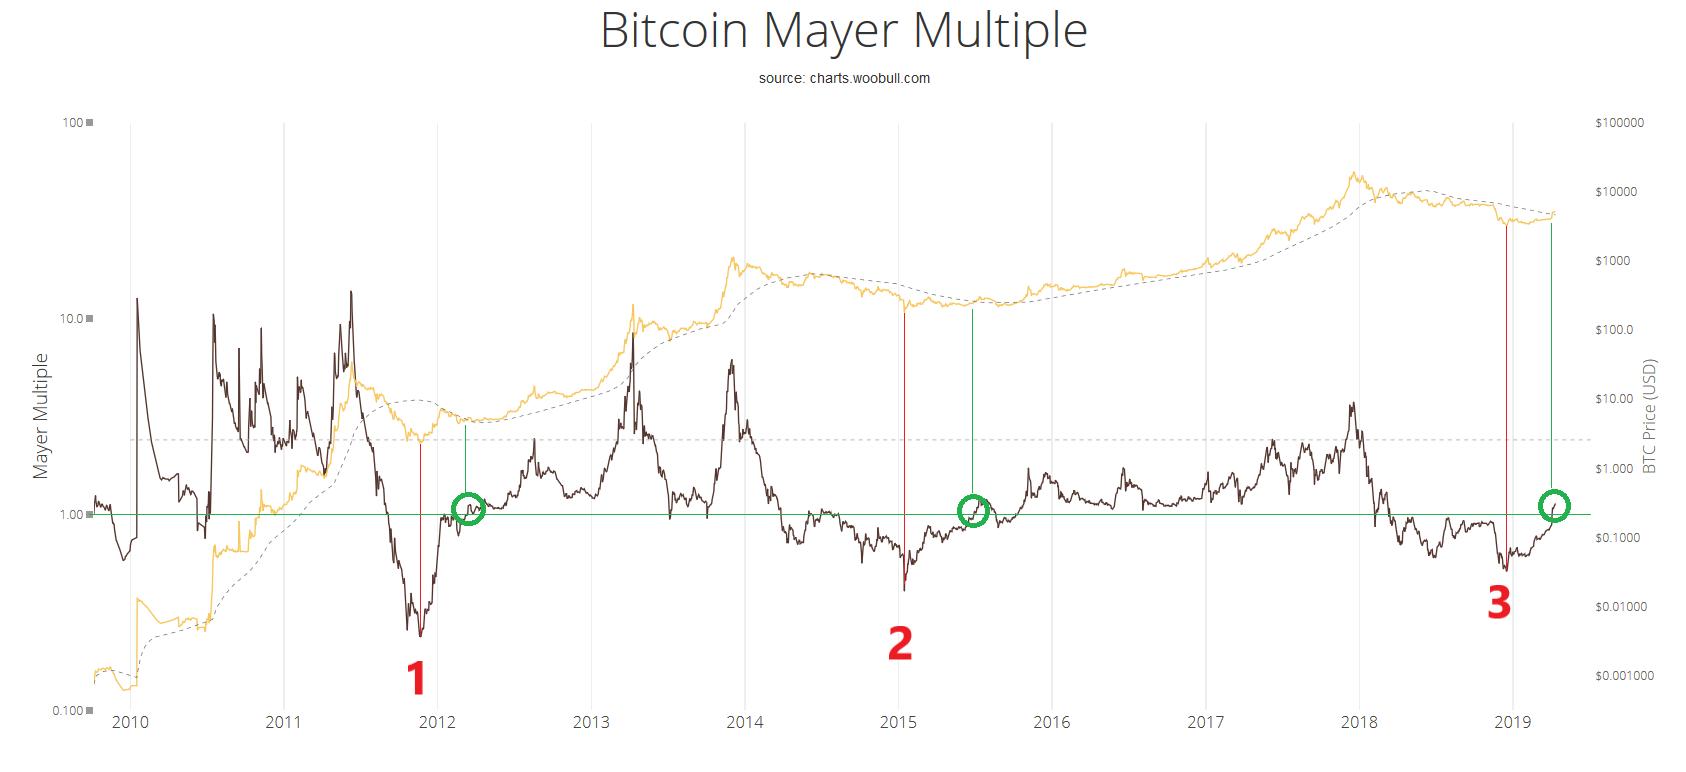
The MM indicator is a simple ratio of the price of Bitcoin to its 200-day moving average price. A low MM ratio is indicative of bear market periods. It suggests a trend reversal when the ratio reaches the 1.0 boundary point.
Historical patterns are usually an important aspect of deducing future BTC price action. In previous cycles, the MM moving above 1.0 marked the end of a Bitcoin market. This was followed by a period of consolidation leding up to the next bull-run.
Think the MM will be above 1.0 for a while the dip back below. Next time it pops up above 1 after that will signal the bull market. pic.twitter.com/LAzVBgc5pl
— jimbonaut
(@hexlib) April 6, 2019


The consolidation period is usually characterized by sideways price action signaling an accumulation phase. In 2012 and 2015 this period lasted six months and three months, respectively.
Given the recent BTC resurgence that catapulted the price above $5,000, many analysts have said the downward market trend has finally been broken.
As reported recently by Bitcoinist, Binance Research also found evidence to suggest that the market has already bottomed out.
Timeline for Parabolic BTC GrowthThe next phase of parabolic growth will be of particular interest to market participants given the forecasts by some analysts of the possibility of a new all-time high (ATH).
Bitcoin’s current ATH stands at $19,700 set in mid-December 2017. Veteran trader and analyst, Peter Brandt who called the 80 percent drop of 2018 thinks BTC looks set to enter another “parabolic” growth phase.

For bitcoin investor Trace Mayer, 2021 could see Bitcoin go as high as $100,000 to $250,000. Many analysts say the upcoming 2020 halving will also create an additional tailwind for a more bullish upward lift based on historical precedents.
In a previous Bitcoinist article, Tom Lee of Fundstrat predicted that BTC would top $10,000 in 2019.
Now, all eyes will be on BTC/USD to see if the accumulation and sideways phase continues, or if bitcoin does indeed skyrocket to the moon.
Is the Bitcoin bear market over? Share your thoughts in the comments below.
Images via woobull.com, Twitter (@hexlib), Shutterstock
The post Key Bitcoin Indicator That Correctly Called 2015 Bottom is Flashing Again appeared first on Bitcoinist.com.
read more