


Coinboard - 1/17/2021 9:28:07 PM - GMT (+0 )

LTC Price Prediction – January 17
The price of Litecoin is seen moving towards the south as the coin falls from its range within the channel.
LTC/USD MarketKey Levels:
Resistance levels: $175, $180, $190
Support levels: $110, $100, $90
According to the daily chart, LTC/USD is moving on the negative side, trading below the 9-day and 21-day moving averages. However, LTC/USD could not avoid the bearish wave that ranged the market in the last few days. This painful downward trend exerted intense pressure on key support established below $150. More so, the declines devastated the support zone and pushed the coin to less than $140 today.
What is the Next Direction for Litecoin?Looking at the daily chart, traders can see that LTC is currently hovering at $142.74. Therefore, if the price level can be maintained, traders could consider a buyback with $150 support-turned-resistance before breaking above the 9-day and 21-day moving averages to touch the resistance levels at $175, $180, and $190. But as it is now, the bears are making an attempt to visit close supports before climbing higher again.
Moreover, LTC/USD is now following a sideways movement within the channel formation, and this shows that the market is indecisive. More so, if the price moves below the lower boundary of the channel, which corresponds to the support at $125, traders can expect the LTC market to continue its downward pressure and the price could slip to the critical supports at $110, $100, and $90 respectively as the RSI (14) moves below 55-level in the same direction, confirming a sideways movement.
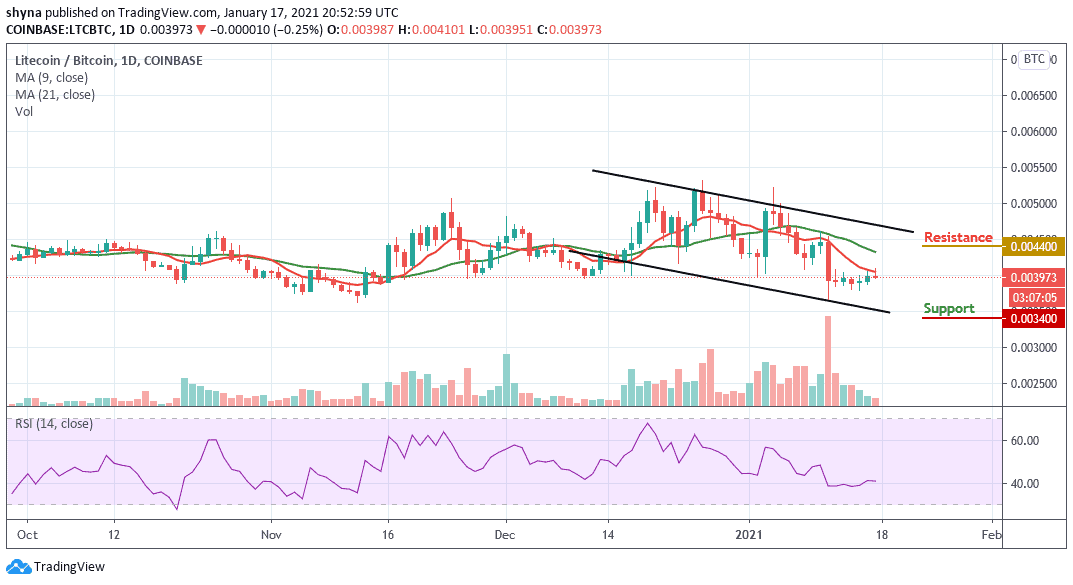
Against Bitcoin, the price of Litecoin continues to follow the bearish trend as the support further outweighs the resistance. Meanwhile, should in case a trend reversal play out, there is a need for an increasing volume and resistance to cause an upsurge in the market. Now, the coin is trading around the 3973 SAT below the moving averages. We can expect close support at the 3400 SAT and below as the RSI (14) moves above the 40-level.
However, there’s no sign of a bullish movement in the LTC market at the moment. Therefore, if a bullish move occurs and validates a break significantly above the moving averages; we can then confirm a bull-run for the coin and the closest resistance lies at 4400 SAT and above.
read more