


ZyCrypto - 5/20/2019 8:07:00 PM - GMT (+0 )


Resistance levels: $0.14, $0.16, $0.18
Support level: $0.12, $0.09, $0.07
XLM/USD Price Long-term Trend: Bullish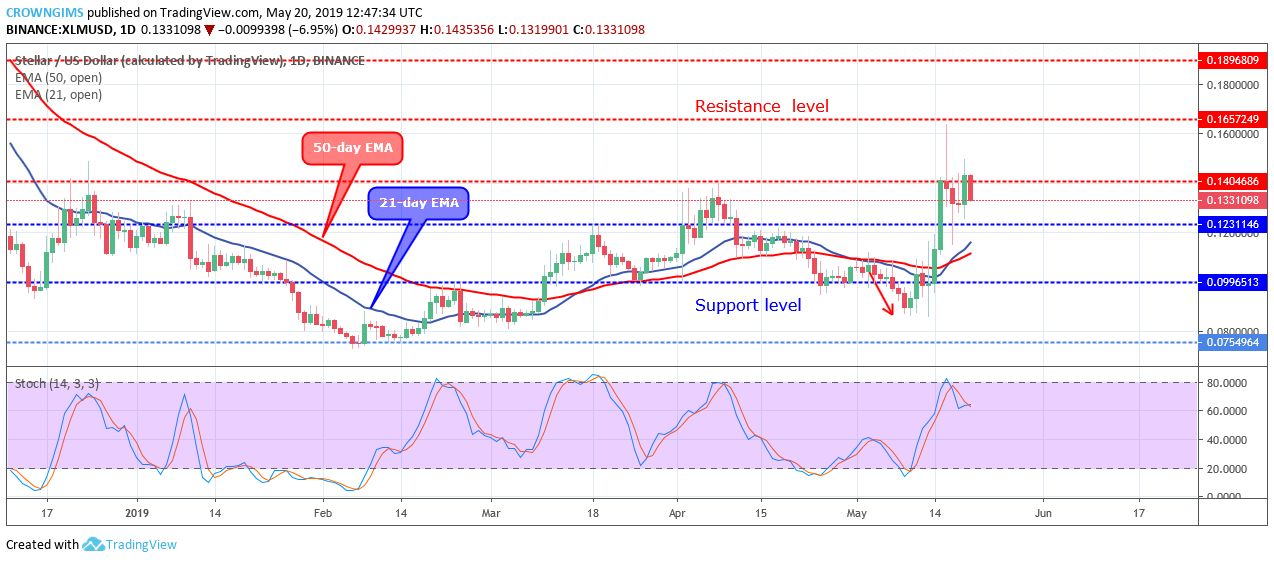
The XLM price is on the bullish trend in the long-term outlook. XLM had a massive bullish move last week on the daily chart. That bullish momentum propelled the coin to the north side, in which $0.09, $0.12 and $0.14 levels were broken upside and the XLM price topped at $0.16.
Then, the price started having a correction. A massive bearish pin bar emerged at the supply level of $0.16 made the price start having a correction. On May 17, another daily bearish candle pushed the price down towards the previous low of $0.09 level before it was rejected by the Bulls. XLM price is currently ranging in between $0.14 and $0.12 level.
XLM price has crossed over the 21 periods and 50 periods EMA upside; the price is trading above the two EMAs with a wide distance between the coin and the EMAs which connotes a strong bearish trend in the XLM market. The Stochastic Oscillator period 14 at 60 levels with the signal lines close together without significant direction indicates that consolidation is ongoing in the XLM daily chart,
In case, $0.13 level hold the price and the bears intensify their pressure, $0.12 demand level may be penetrated and expose the price to $0.09 level. Should the Bears lose their momentum then XLM price may resume its bullish trend.
XLM/USD Price Medium-term Trend: Bearish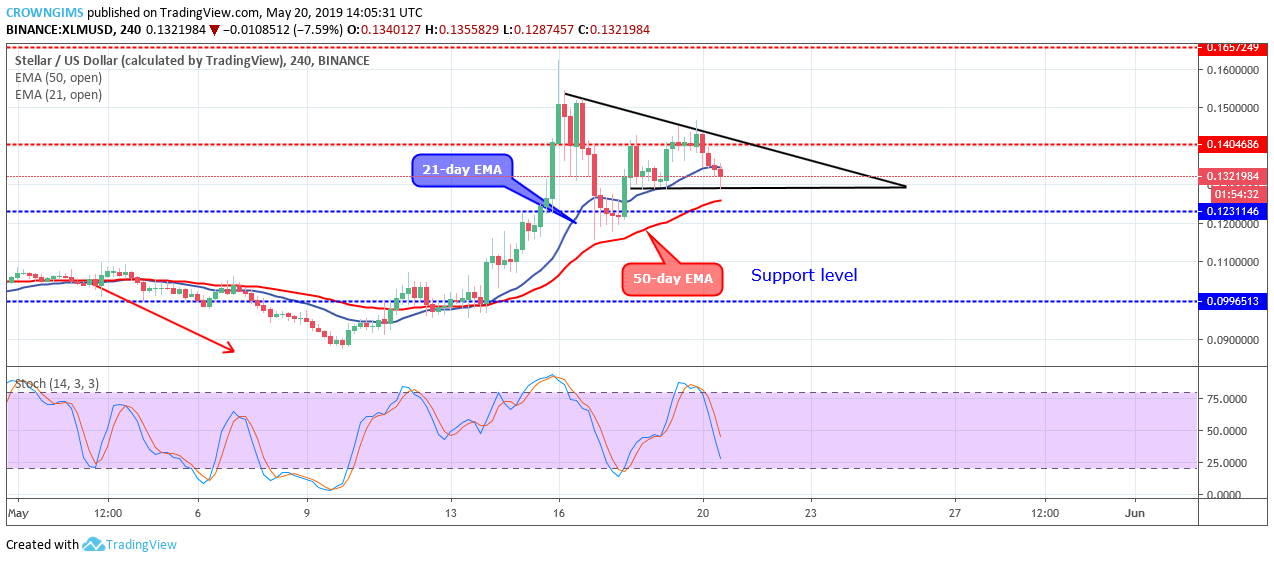
On the medium-term trend, the XLM price is bearish. The bullish momentum that started last week on the 4-Hour chart has been interrupted today by the Bears at $0.14 levels. At the opening of the XLM market today, a bearish engulfing candle emerged that triggered the bearish pressure.
The price started declining towards $0.133 level. The price action has formed a descending triangle in the 4-hour chart of the XLM market.
Breaking out of the price at the lower trend line of the triangle may lead the price towards $0.11 level in case the $0.13 level does not hold. The Stochastic Oscillator is above 25 levels with the signal lines pointing down to indicate sell signal.
♥Get Daily Crypto News On Facebook | Twitter | Telegram | Instagram
read more